
Microsoft’s new RTO policy starts Feb. 23, bringing Seattle-area workers back 3 days a week
Microsoft’s three-day-a-week return-to-office mandate starts Monday, Feb. … Read More
Microsoft recently drew the attention of a privacy researcher to one of Edge’s lesser-known features through a post on X, describing Edge Secure Network VPN as a free, built-in privacy tool that requires no additional apps or subscriptions.
The post, by the official Microsoft Edge handle, positioned the feature as a simple way to add an extra layer of protection while browsing, particularly on public Wi-Fi networks, and encouraged users to turn it on directly from Edge’s settings.

The feature is called Edge Secure Network VPN, and in theory, it could free you from installing third-party VPN services, as it is already baked into Edge, but it does have a limited monthly data allowance.

Not long after, a privacy researcher responded with a detailed technical critique, arguing that the feature operates very differently from what most people associate with a traditional VPN. That reply quickly gained traction and shifted the conversation to a debate about how browser-integrated privacy tools should be described and what level of protection users should realistically expect.
“Edge Secure Network is NOT a VPN. It’s an HTTP CONNECT proxy built on Cloudflare’s Privacy Proxy Platform. It only tunnels traffic inside the Edge browser”, says Sooraj Sathyanarayanan, a Privacy Researcher & Security Strategist, who works at Brave Browser.
We have reached out to Microsoft for additional clarification on how it characterizes Edge Secure Network VPN and will update this story if we hear back.
Sooraj’s claims are largely true, but to understand where the disagreement comes from, it helps to first look at how Microsoft itself explains what Edge Secure Network VPN is meant to do.
According to Microsoft’s feature documentation, Edge Secure Network VPN is a lightweight, browser-level protection feature that uses “VPN technology” to encrypt traffic generated inside Microsoft Edge, helping shield browsing activity from third parties, trackers, or malicious actors.
If you are browsing from a public network, like a coffee shop or airport, Edge can route that browser traffic through an encrypted tunnel so sensitive data, such as logins, payment details, or form submissions, cannot be intercepted. Microsoft also says the feature obscures the user’s IP address from websites, adding an additional layer of privacy while browsing.
To turn on Edge Secure Network VPN, click the three dots in Edge, select More tools, and click Secure Network. Click Get VPN for free, and sign in to your Microsoft account.
Edge Secure Network is available at no extra cost, but only for users signed into Edge with a personal Microsoft account. The free tier includes a 5GB monthly data allowance, after which the protection stops until the quota resets. To conserve that data, certain high-bandwidth scenarios, including video streaming services like Netflix, Hulu, HBO, and more, are excluded from routing through the feature.
Note that some people use VPN services exclusively to bypass streaming platforms’ filtering of content for certain regions.
Edge Secure Network VPN has some other limitations, too. The feature is currently unavailable on managed or enterprise devices and does not work in certain regions. It also does not support manual server selection, which Microsoft confirmed in response to a user question on X, noting that Secure Network automatically connects to a geographically nearby server rather than allowing users to choose a country or region.

However, Microsoft describes the system as being smart enough to activate automatically in situations it considers higher risk, such as when visiting sites that are not fully secured. Users can also manually control how it behaves, choosing whether to enable it selectively or expand coverage to more browsing sessions.
From Microsoft’s perspective, Edge Secure Network VPN is a built-in safeguard designed to add baseline protection without requiring users to install or configure third-party tools. It is not marketed in official documentation as a full replacement for standalone VPN services, although the company does use phrases like “free VPN data protection every month” and “uses VPN technology”.
The clever marketing wasn’t enough to deter a security analyst from critiquing the feature.

The promotional language around Edge Secure Network VPN prompted a detailed response from Sooraj Sathyanarayanan, a Privacy Researcher and Brave Browser employee, who argues that the feature behaves very differently from what most users expect when they hear the word “VPN.”
According to the analysis, Edge Secure Network operates as a browser-level tunneling mechanism rather than a system-wide virtual private network. So, only traffic generated inside Microsoft Edge is routed through the protected channel. Activity from other applications, background services, email clients, operating system updates, and even DNS queries would continue to use the regular network path.
He describes the feature as an HTTP CONNECT proxy built on Cloudflare’s Privacy Proxy infrastructure, designed to secure browsing sessions within Edge itself, not to create a device-wide encrypted tunnel. Note that many commercial VPN tools route all system traffic through a secure endpoint, with kill switches and user-configurable server locations.
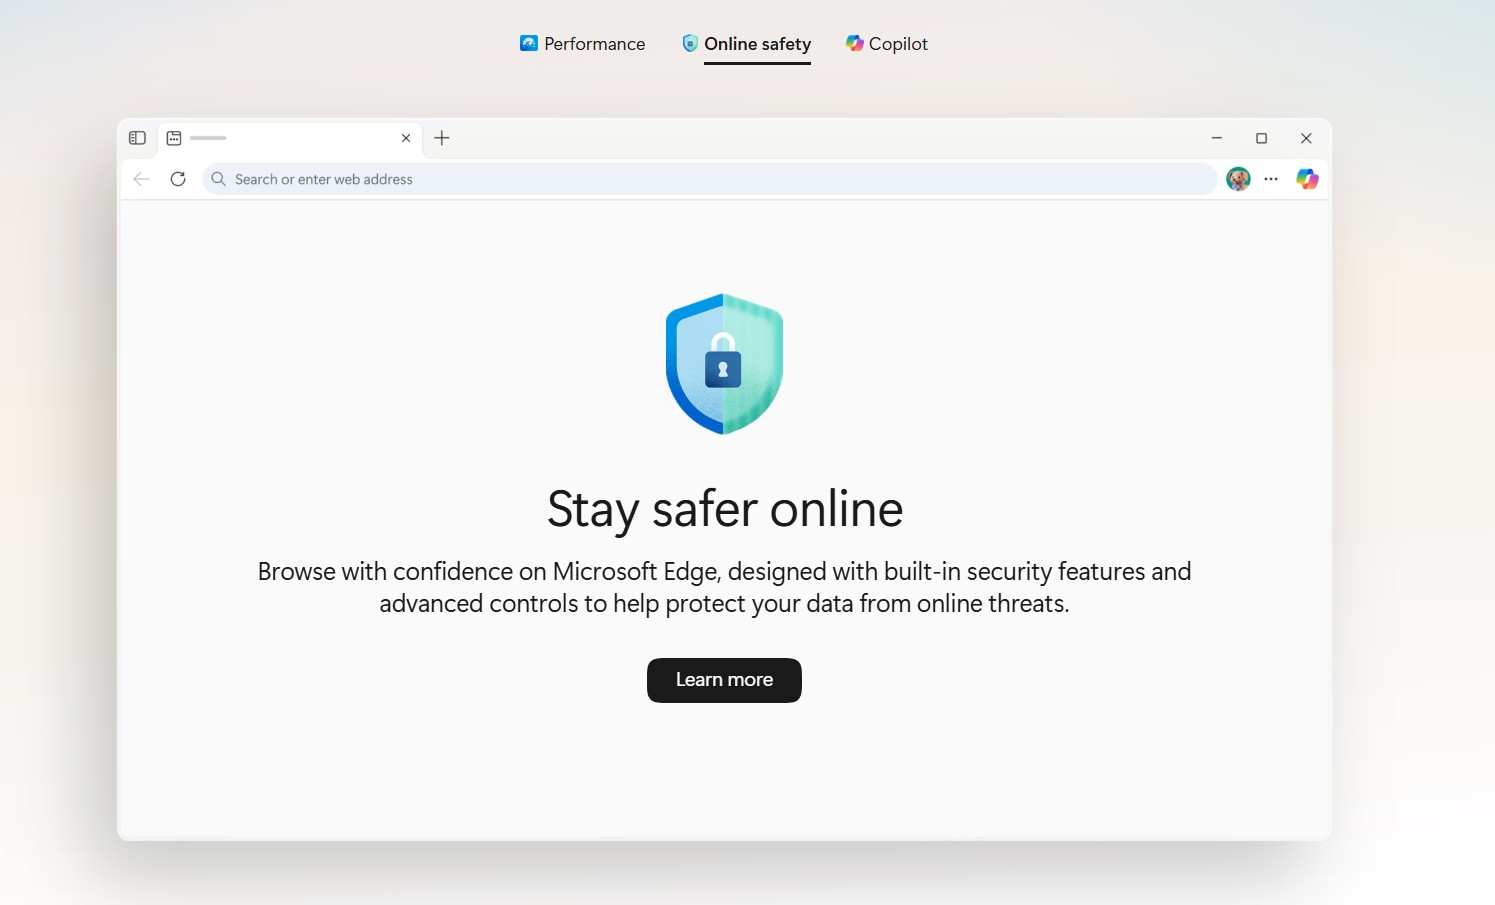
The analysis also notes that Edge Secure Network ships in what Microsoft calls an “Optimized” mode by default, meaning the protection may only activate under certain conditions, such as when using public Wi-Fi or visiting non-HTTPS sites, unless users manually change the configuration to cover all browsing scenarios.
Another point raised is the requirement to sign in with a personal Microsoft account to enable the feature. Microsoft says this is necessary to enforce the 5GB monthly usage cap, but the researcher argues that it connects the protection layer to an authenticated identity and not an anonymous usage.
Sathyanarayanan further describes the architecture as a two-party trust model, where Microsoft manages account identity while network routing is handled by Cloudflare.
Microsoft assures that Cloudflare does not see account identities, and Cloudflare states it does not inspect user traffic, but the researcher points out that the system relies on trusting both parties’ claims without an independent public audit.
The critique also notes concerns about the lack of manual region selection, limited transparency into routing behavior, and the absence of certain protections that full-device VPN software provides.
Microsoft is not alone in the quest to add network protection directly into the browser. Opera, for example, has long shipped a built-in VPN feature inside the browser, setting it as an integrated privacy layer.
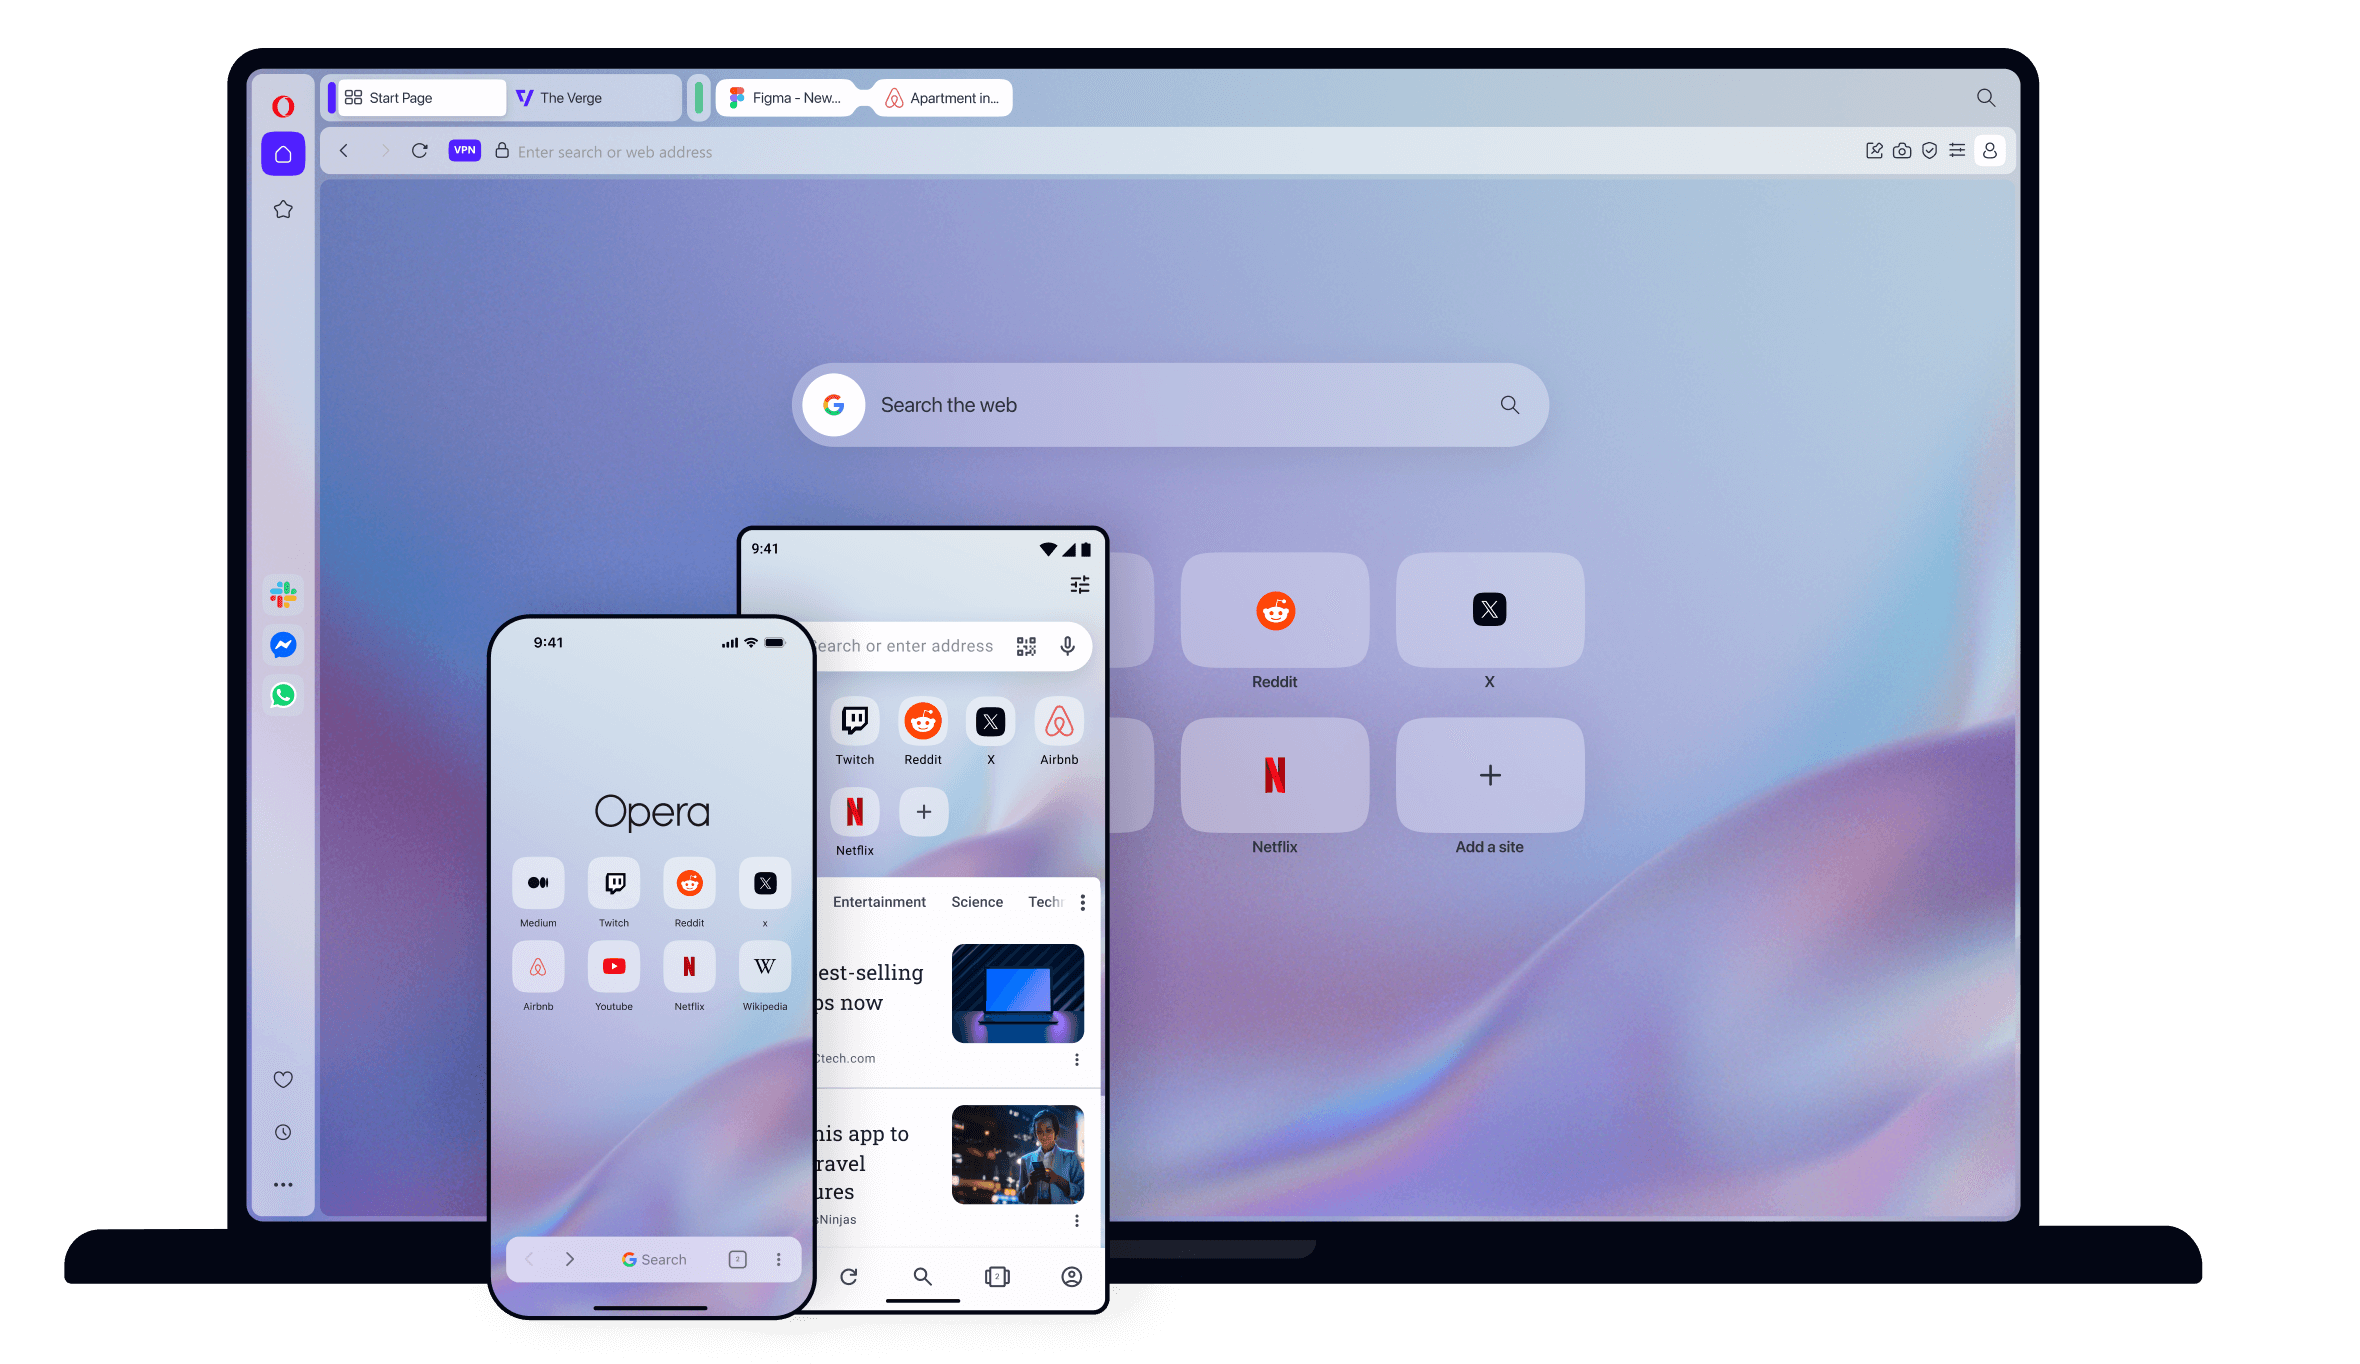
These built-in tools are set for a convenience-first world. They turn on automatically in certain situations, require minimal setup, and reduce obvious risks like unsecured Wi-Fi connections. They also avoid the performance impact that system-wide VPN software introduces.
At the same time, browser-integrated protections are not meant to be a replacement for traditional VPN services.
Clarity about what these features do and do not cover is increasingly important for user trust. Whether the feature is seen as a useful safeguard or something overstated will likely depend on how Microsoft continues to explain its role and limitations.
The post Privacy researcher debunks Microsoft Edge’s free VPN marketing, says it’s “NOT a VPN” appeared first on Windows Latest
It was close to midnight and the system was not behaving the way it should. CPU was hovering around 85 percent, PAGEIOLATCH waits were climbing steadily, and one particular stored procedure had suddenly become the villain of the evening. I had the actual execution plan open. A Hash Match that clearly did not belong there. A Key Lookup that was blowing up row counts. An estimated versus actual row mismatch that was almost embarrassing to look at. Let us talk about The Strange Emotional Shift of Working Alongside a Machine That “Thinks”.

I have seen this pattern before. Cardinality estimation gone wrong. Parameter sniffing, maybe. Or outdated statistics. This is the kind of puzzle I have solved for decades. You start with sys.dm_exec_query_stats. You check wait stats. You glance at missing index DMVs, but you do not trust them blindly. You think about workload patterns, concurrency, memory grant pressure. It is not just technical analysis. It is instinct, built from years of late-night production calls and early-morning postmortems.
Out of curiosity more than need, I pasted the query and some surrounding details into an AI assistant.
Within seconds, it responded with structured reasoning. It pointed out the Key Lookup and suggested a covering nonclustered index. It mentioned parameter sniffing and recommended OPTIMIZE FOR or OPTION (RECOMPILE). It even explained the row estimate mismatch in plain, simple language.
I stared at the screen.
Not because it was revolutionary. But because it was fast.
And in that speed, something inside me felt unsettled.
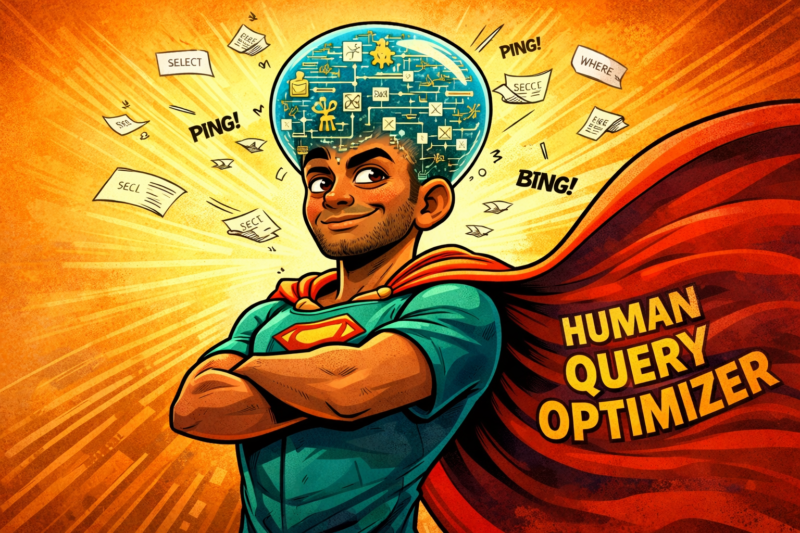
For most of my career, I have joked that my brain is the real query optimizer. Before SQL Server decides on a plan, I have already predicted what it might choose. If a table has skewed data distribution, I can almost sense where the plan will break. If the memory grant is too generous, I anticipate spills to tempdb. If CXPACKET waits suddenly spike, I am already thinking about parallelism thresholds and cost threshold for parallelism before anyone opens sp_configure.
This ability did not come from reading documentation alone. It came from nights spent firefighting blocking chains. From watching deadlocks unfold in Profiler. From tuning queries where a missing index was not the answer because the entire data model needed to be rethought. That kind of thinking was never mechanical. It was deeply personal. It was the craft of performance tuning. Messy, hard-won, and irreplaceable.
So when a machine begins to replicate parts of that thinking, even partially, it touches something beyond convenience.
It makes you question whether what you believed was uniquely earned can now be simulated.
That is not an easy feeling to sit with.

There is a quiet comparison that happens when you read AI-generated analysis of a complex SQL Server issue. You read it and instinctively measure it against your own thinking. You ask yourself, would I have explained the memory grant issue this way? Would I have pointed at the Nested Loops operator first? Sometimes you feel reassured because you spot the gaps. The AI suggests creating an index without considering write overhead on a busy OLTP system. It does not understand that this database runs 24×7 and cannot afford heavy index maintenance windows. It does not factor in the fragmentation that a wide nonclustered index will introduce on tables with high insert rates.
But sometimes, and this is the uncomfortable part, the explanation is clean. Logical. Structured. It reads like something you would confidently present in a performance review meeting.
And in that moment, your ego runs its own little execution plan. It calculates your value. It estimates your uniqueness. It checks its own cost model.
If clarity can be generated in seconds, what exactly is your edge now?
That question is not really about job security. It is about identity.
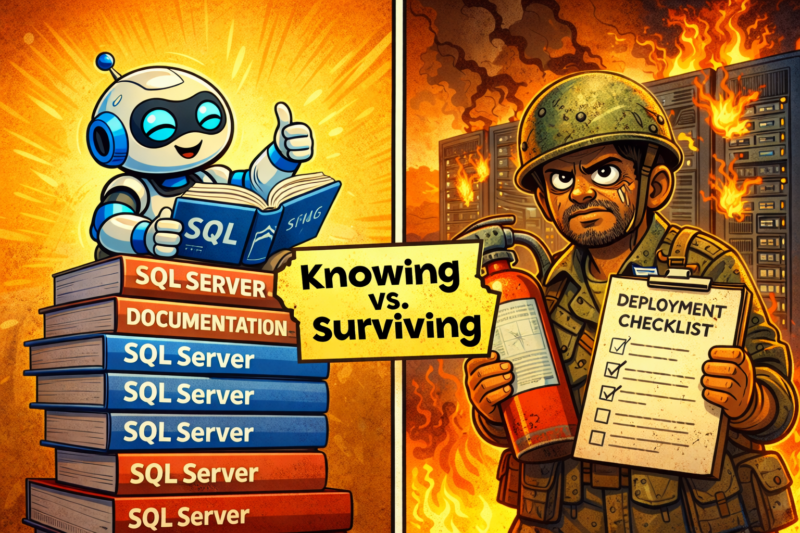
AI can scan massive volumes of SQL Server documentation in an instant. It can explain the differences between READ COMMITTED SNAPSHOT and SERIALIZABLE isolation levels. It can talk about fragmentation thresholds, fill factor adjustments, statistics update strategies, and Query Store baselines. It can even walk through troubleshooting steps using DMVs in a way that sounds remarkably competent.
But it does not sit in the room when a wrong index decision causes write latency to climb across the entire OLTP workload. It does not remember the production outage three years ago where a well-intentioned index change triggered unexpected lock escalation during peak hours. It does not feel the weight of looking a business leader in the eye and telling them that their reporting query is fundamentally flawed, and that the fix is a redesign, not a hardware upgrade.
Experience changes how you think. Not just what you know, but how carefully you apply it.
When I recommend creating an index, I am not thinking about that one query alone. I am thinking about write overhead, maintenance windows, fragmentation behaviour, rebuild strategy, storage impact, and long-term scalability. That layered thinking comes from consequence. From having made decisions that went wrong and learning from them in real time, under real pressure.
Consequence cannot be simulated.

There is another uncomfortable truth here. AI reduces friction. And friction is exactly where expertise gets sharpened.
When I first learned performance tuning, I manually inspected execution plans operator by operator. I traced each arrow. I looked at estimated subtree cost and compared it against actual runtime behaviour. I learned, slowly and painfully, to correlate wait stats with workload patterns. That struggle built instinct. It trained my internal model of how SQL Server behaves under stress.
If I now rely entirely on AI-generated summaries to interpret execution plans, I will certainly save time. But will my internal model stay sharp? Will I still be able to diagnose a complex concurrency issue without outside help? Or will my brain slowly offload pattern recognition to an external system, the way muscles weaken when you stop using them?
This is not about rejecting AI. I am not arguing for that.
It is about protecting cognitive depth.
Because output can remain high while depth quietly decreases. And depth is what makes expertise resilient, especially in the moments that matter most.

Over time, I have started to see this shift differently. AI is not replacing my thinking. It is changing my role.
Earlier, I was the primary solver. I was the one who found the answer. Now, I am increasingly the strategist. AI can suggest ten tuning options. It can propose query rewrites, index additions, MAXDOP adjustments, changes to cost threshold for parallelism. It can generate those recommendations quickly and coherently.
But I decide which lever to pull.
I decide whether a plan guide makes sense for this particular scenario. I decide whether forcing a plan through Query Store is safe given this workload’s volatility. I decide whether the right answer is a configuration change, an architectural redesign, or an honest conversation with the development team about how their code interacts with data.
Decision-making under uncertainty remains deeply human. And as the number of available options multiplies, judgement does not become less important. It becomes more critical.

The strange emotional shift of working alongside a machine that “thinks” is not dramatic or loud. It does not arrive in a single moment. It is gradual and deeply personal. It forces you to sit quietly with yourself and examine what part of your expertise is information and what part is wisdom.
When I look at a slow SQL Server today, I still open the execution plan manually. I still examine wait stats. I still think carefully about memory grants, parallelism, index design, and workload patterns. Those habits are not going anywhere.
But I also allow myself to collaborate. I use AI to pressure-test my assumptions, to explore alternate approaches I might not have considered, to draft structured explanations faster than I could on my own. And then I layer my experience on top of it.
The machine may suggest an index. But it does not carry the responsibility of implementing it in production at 2 AM when hundreds of users are active. It may produce reasoning about deadlocks or blocking chains. But it does not carry the memory of past incidents that make you cautious. The ones that taught you to pause before acting, even when you are confident.

It does not feel the pressure of accountability. That remains entirely human.
In the end, this shift is not really about machines becoming intelligent. It is about us becoming more intentional about how we think. If we use AI carelessly, it will slowly replace depth with convenience. If we use it consciously, it will amplify decades of hard-earned experience into something even more powerful.
The choice is not technical. It is psychological.
And that choice still belongs to us.
Reference: Pinal Dave (https://blog.sqlauthority.com), X (twitter).
First appeared on The Strange Emotional Shift of Working Alongside a Machine That “Thinks”
What is imagery and how do you use it in fiction writing? We define imagery and explain how fiction writers can use it in their stories.
“Description composed of sensory detail penetrates layers of consciousness, engaging your reader emotionally as well as intellectually…” ~Rebecca McClanahan
Imagery is a literary device that allows us to immerse ourselves in the stories we read. It is a type of description – one of the most effective ways to show and not tell, where we are able to experience fiction in someone else’s shoes. As writers, we use the five senses (sound, taste, smell, touch, sight) to create these unforgettable scenes. The writing is so vivid that we feel as if we are part of the story. The use of motifs is also a powerful way to use the senses.
Using imagery also includes figurative language like metaphors and similes to convey emotions, setting, and mood.
There are five types of imagery:
The use of imagery (the five senses) is important when we create a character’s world. If we do it well, the reader will experience it in real time as they soak in the words.
Top Tip: The Visual Storytelling Workbook may also be useful to you.

by Amanda Patterson
© Amanda Patterson
Top Tip: Find out more about our workbooks and online courses in our shop.
The post What Is Imagery & How Do You Use It In Fiction Writing? appeared first on Writers Write.
The Claude C Compiler: What It Reveals About the Future of Software
On February 5th Anthropic's Nicholas Carlini wrote about a project to use parallel Claudes to build a C compiler on top of the brand new Opus 4.6Chris Lattner (Swift, LLVM, Clang, Mojo) knows more about C compilers than most. He just published this review of the code.
Some points that stood out to me:
- Good software depends on judgment, communication, and clear abstraction. AI has amplified this.
- AI coding is automation of implementation, so design and stewardship become more important.
- Manual rewrites and translation work are becoming AI-native tasks, automating a large category of engineering effort.
Chris is generally impressed with CCC (the Claude C Compiler):
Taken together, CCC looks less like an experimental research compiler and more like a competent textbook implementation, the sort of system a strong undergraduate team might build early in a project before years of refinement. That alone is remarkable.
It's a long way from being a production-ready compiler though:
Several design choices suggest optimization toward passing tests rather than building general abstractions like a human would. [...] These flaws are informative rather than surprising, suggesting that current AI systems excel at assembling known techniques and optimizing toward measurable success criteria, while struggling with the open-ended generalization required for production-quality systems.
The project also leads to deep open questions about how agentic engineering interacts with licensing and IP for both open source and proprietary code:
If AI systems trained on decades of publicly available code can reproduce familiar structures, patterns, and even specific implementations, where exactly is the boundary between learning and copying?
Tags: c, compilers, open-source, ai, ai-assisted-programming, anthropic, claude, nicholas-carlini, coding-agents
Read more of this story at Slashdot.
Get caught up on the latest technology and startup news from the past week. Here are the most popular stories on GeekWire for the week of Feb. 15, 2026.
Sign up to receive these updates every Sunday in your inbox by subscribing to our GeekWire Weekly email newsletter.

Microsoft’s three-day-a-week return-to-office mandate starts Monday, Feb. … Read More

Washington’s House on Saturday approved a slate of rules for data centers around energy costs and transparency. … Read More

In addition to events such as demo nights, founder dinners, and hackathons, Bili House is looking into partnerships, perhaps with a venture capital firm that could help defer some costs for startup founders. … Read More

The idea for Legata grew out of frustration with Washington’s estate tax and how little many families understand about the risk to their assets if they don’t plan. … Read More

Paul Brainerd, who coined the term “desktop publishing” and built Aldus Corporation’s PageMaker into one of the defining programs of the personal computer era, died Sunday at his home on Bainbridge Island. … Read More

Veteran tech and finance executive Sebastian Gunningham will replace Oppenheimer as CEO of the Seattle-based company. … Read More

The ubiquitous tap-to-pay technology that has become commonplace in grocery stores and coffee shops is coming to Seattle-area buses and trains beginning Feb. … Read More

Phil Spencer, who reshaped Xbox through landmark acquisitions and a bet on cloud gaming, is stepping down. … Read More

Cloud cost consultant Duckbill, known for co-founder Corey Quinn’s sharp takes on AWS, raises $7.75M and launches Skyway, a financial planning and forecasting platform for enterprise cloud spending. … Read More

The latest round, led by Andreessen Horowitz, doubles the company’s valuation from October and reflects surging demand for infrastructure that keeps AI running reliably in production as agentic systems move from pilot projects to mission-critical deployments. … Read More