Sr. Content Developer at Microsoft, working remotely in PA, TechBash conference organizer, former Microsoft MVP, Husband, Dad and Geek.
150620 stories
·
33 followers

AI Dev Days 2025: Your Gateway to the Future of AI Development

1 Share

What’s in Store?

Day 1 – 10 December:
Video Link

Building AI Applications with Azure, GitHub, and Foundry
Explore cutting-edge topics like:

  • Agentic DevOps
  • Azure SRE Agent
  • Microsoft Foundry
  • MCP
  • Models for AI innovation

Day 2 – 11 December Agenda:
Video Link 


Using AI to Boost Developer Productivity
Get hands-on with:

  • Agent HQ
  • VS Code & Visual Studio 2026
  • GitHub Copilot Coding Agent
  • App Modernisation Strategies

Why Join?

  • Hands-on Labs: Apply the latest product features immediately.
  • Highlights from Microsoft Ignite & GitHub Universe 2025: Stay ahead of the curve.
  • Global Reach: Local-language workshops for LATAM and EMEA coming soon.

You’ll recognise plenty of familiar faces in the lineup – don’t miss the chance to connect and learn from the best!

👉 Register now and share widely across your networks – there’s truly something for everyone!
https://aka.ms/ai-dev-days

Read the whole story
alvinashcraft
23 minutes ago
reply
Pennsylvania, USA
Share this story
Delete

How .NET 10.0 boosted AIS.NET performance by 7%

1 Share

TLDR; .NET 10.0 increased performance in our Ais.NET library by 7% with no code changes. Performance is well over twice as fast as it was on .NET Core 3.1 when we first released this library. A Surface Laptop Studio 2 can process 10.14 million messages per second!

At endjin, we maintain Ais.Net, an open source high-performance library for parsing AIS messages (the radio messages that ships broadcast to report their location, speed, etc.). Each time a new version of .NET ships, we check it all still works and then run our benchmarks again. Each year, we've seen significant improvements:

So what about .NET 10.0? The short answer is that yet again it is significantly faster. For continuity I have run the benchmarks on the same desktop computer as when I first started benchmarking this library, meaning these figures are all directly comparable.

For the fifth year running, we're enjoying a free lunch! Without making any changes whatsoever to our code, our benchmarks improved by roughly 7% simply by running the code on .NET 10.0 instead of .NET 9.0. As with last time, we've not had to release a new version—the existing version published on NuGet (which targets netstandard2.0 and netstandard2.1) runs faster just as a result of upgrading your application to .NET 10.0.

Admittedly, this year's improvement is the smallest yet. But if you had asked me back in 2019 when we first wrote this library whether I'd expect to see each subsequent release of .NET make the library run faster and faster, with the aggregate improvement making the library run over 2.1x faster, I would have been sceptical.

Our memory usage is roughly the same. Our amortized allocation cost per record continues to be 0 bytes. The total memory usage including startup costs is very similar: a handful of kilobytes, depending on exactly which features you use.

Benchmark results

We have two benchmarks. One measures the maximum possible rate of processing messages, while doing as little work as possible for each message. This is not entirely realistic, but it's useful because it establishes the upper bound on how fast an application can process AIS messages on a single thread. The second benchmark uses a slightly more realistic workload, inspecting several properties from each message. Each benchmark runs against a file containing one million AIS records.

.NET 8.0

When I tested on .NET 8.0 in November 2023, I saw the results shown in this next table when running the benchmarks on my desktop. These figures correspond to an upper bound of 5.72 million messages per second, and a processing rate of 4.75 million messages a second for the slightly more realistic example. (The desktop I've run all these benchmarks on is now about 8 years old, and it has an Intel Core i9-9900K CPU.)

Method Mean Error StdDev Allocated
InspectMessageTypesFromNorwayFile1M 174.7 ms 2.20 ms 2.06 ms 4 KB
ReadPositionsFromNorwayFile1M 210.5 ms 4.15 ms 4.08 ms 5 KB

.NET 9.0

These were the numbers for .NET 9.0. The upper bound is 6.38 million messages per second, and the more realistic example processes 5.20 million messages per second.

Method Mean Error StdDev Allocated
InspectMessageTypesFromNorwayFile1M 156.7 ms 1.04 ms 0.97 ms 4.13 KB
ReadPositionsFromNorwayFile1M 192.3 ms 1.33 ms 1.18 ms 4.13 KB

I repeated these tests just now on the very latest .NET 8.0 and .NET 9.0 runtimes to check that my hardware setup hadn't changed in a way that was affecting performance. (We've been benchmarking all the way back to .NET Core 2, but I only repeat the measurements on runtimes still in support.) Within the bounds of experimental noise, the results were essentially the same. (That's what you'd hope, given that this is running on the same hardware, but the .NET runtime does get regular updates, so it's worth checking performance has remained the same on those versions. It's also important to check that I've not done something to my machine to change its performance. In fact, first time I re-ran these, I got slower numbers. Turns out I hadn't been as thorough as I meant to be when shutting down other processes to get the machine as close to idle as possible. So it was well worth repeating the measurements for older runtimes—otherwise I'd have been making .NET 10.0 look less good than it is.)

.NET 10.0

And now, the .NET 10.0 numbers:

Method Mean Error StdDev Allocated
InspectMessageTypesFromNorwayFile1M 148.1 ms 0.82 ms 0.77 ms 4.14 KB
ReadPositionsFromNorwayFile1M 179.3 ms 2.45 ms 2.30 ms 4.14 KB

This shows that on .NET 10.0, our upper bound moves up to 6.75 million messages per second, while the processing rate for the more realistic example goes up to 5.58 million messages per second. Those are improvements of 6% and 7% respectively from .NET 9.0. (I put the 7% figure in the blog title because that benchmark better represents what a real application might do. I've done this in previous years regardless of which of the two benchmarks showed the larger of the two increases.)

Surface Laptop Studio 2

You might be wondering where the 10.14 million messages per second figure in the opening paragraph came from. That's from running the same benchmark on newer hardware. I use my old desktop to get a consistent view of performance changes over time, but it understates what's possible on current hardware. Here are the numbers from my laptop (a Surface Laptop Studio 2 with a 13th gen Intel Core i7-13800H):

Method Mean Error StdDev Allocated
InspectMessageTypesFromNorwayFile1M 98.62 ms 0.542 ms 0.507 ms 3.93 KB
ReadPositionsFromNorwayFile1M 114.41 ms 0.753 ms 0.704 ms 3.93 KB

That gives us 10.14 million messages per second for the basic inspection, and 8.76 million messages per second with the more realistic workload.

Free performance gains over time

The bottom line is that just as moving your application onto .NET 9.0 may well have given you an instant performance boost with no real effort on your part (as did moving to .NET 8.0, before that, and .NET 7.0, before that, and .NET 6.0 before that) you may enjoy a similar boost upgrading to .NET 10.0.

We've been running these benchmarks across 7 versions of .NET now (.NET Core 2, .NET Core 3.1, .NET 6.0, .NET 7.0, .NET 8.0, .NET 9.0, and .NET 10.0) enabling us to visualize how performance has improved across these releases for our library. First we'll look at the time taken to process 1 million AIS messages:

Bar chart showing the time in ms to inspect and read positions from 1 million AIS messages for .NET Core 3.1 (inspect: 329.2, read: 384.2), .NET 6.0 (inspect: 262.9, read: 322.8), .NET 7.0 (inspect: 213.8, read: 267.9), .NET 8.0 (inspect: 174.7, read: 210.5), .NET 9.0 (inspect: 156.7, read: 192.3), and .NET 10.0 (inspect: 148.1, read: 179.3)

(I've gone back to showing the figures for my aging desktop, to present a consistent history which is why this and the next graph don't show us breaking through the 10 million messages per second boundary.) And next, the throughput in AIS messages per second (same benchmarks, just a different way to present the results):

Bar chart showing how many AIS messages can be inspected and positions read per second, for .NET Core 2 (inspect:  2,877,698, read:  2,478,315), .NET Core 3.1 (inspect:  3,037,667, read: 2,602,811), .NET 6.0 (inspect:  3,803,728, read:  3,097,893), .NET 7.0 (inspect:  4,677,268, read:  3,732,736), .NET 8.0 (inspect: 5,724,093, read: 4,750,594), .NET 9.0 (inspect: 6,381,620, read: 5,200,208), and .NET 10.0 (inspect: 6,752,194, read: 5,577,244)

Over the time the AIS.NET library has existed, performance has improved by well over double, thanks entirely to improvements in the .NET runtime!

Learn more about AIS.NET

You can learn more about our Ais.Net library at the GitHub repo, http://github.com/ais-dotnet/Ais.Net/ and in the same ais-dotnet GitHub organisation you'll also find some other layers, as illustrated in this diagram:

A diagram showing the Ais.Net library layering as three rows. The top row provides this description of Ais.Net.Receiver: AIS ASCII data stream ingestion using IAsyncEnumerable. Decoded message available via IObservable. The second row provides this description of Ais.Net.Models: Immutable data structures using C# 9.0 Records. Interface expose domain concepts such as position. The third row provides this description of Ais.Net: high performance, zero-allocation decode using Span<T>. ~3 million messages per second per core.

Note that there is a separate repository for Ais.Net.Models. And there's another for the Ais.Net.Receiver project. If you would like to experiment with this library, you will find some polyglot notebooks illustrating its use at https://github.com/ais-dotnet/Ais.Net.Notebooks

Read the whole story
alvinashcraft
24 minutes ago
reply
Pennsylvania, USA
Share this story
Delete

It’s not as bad as you think: Using scorecards in AI testing

1 Share

Who doesn’t like asserts?

We have a habit of confusing “simple” with “easy.” In traditional automation, defining quality was simple. It was binary. Assert.AreEqual(expected, actual). It either matched, or it didn’t. Green or Red.

But with AI, “Good” isn’t binary. It’s complex. There are fifty ways to say “Hello” correctly, and fifty ways to say it rudely. As humans, we handle this complexity intuitively. We read an output that isn’t perfect but captures the main idea, and we think, “Yeah, that’s good enough.”

The problem starts when we try to automate that feeling. Automation hates “mostly right.” Automation wants exactness. And when we try to force a non-deterministic, creative AI into a rigid, binary box, we don’t get quality. Instead we get flaky tests.

The Problem with Rigid Math

Let’s look at a real-world example: My An API Analysis Agent.

It’s an AI agent designed to analyze API endpoints. You give it a prompt: “Analyze this endpoint and give me 3 suggestions for valid inputs, 3 for invalid inputs, and 3 for edge cases.”

In a traditional test, your assertion logic would look something like this:

assert len(suggestions.valid) == 3
assert len(suggestions.invalid) == 3
assert len(suggestions.edge_cases) == 3

Now, let’s say the AI returns:

  • 3 Valid suggestions.
  • 3 Invalid suggestions.
  • 2 Edge cases.

Total: 8 out of 9 requests fulfilled.

In the binary world of traditional automation, this test FAILS. The report goes red. The pipeline stops. You get an alert on Slack. You look at the failure and say, “Stupid AI.” (Not near a microphone, of course, it might hear you).

But wait. Look at the data. It gave you 8 solid suggestions. It found valid inputs and invalid ones. It even found two tricky edge cases. It just missed one edge case. Is that a “Failed” result? Or is it a highly useful result that just didn’t meet an arbitrary count?

By marking this as a failure, you are throwing away value. You are hiding a “good enough” result behind a binary “bad” label.

The Solution: The Scorecard

To fix this, we have to stop testing for Equality and start testing for Utility. We need to shift from binary assertions to a Scorecard.

A Scorecard quantifies “Good Enough.” It breaks the result down into weighted concepts and sums them up.

Let’s translate our API result from before to use a Scorecard approach:

The Criteria:

  • Valid Inputs: 1 point each (Max 3)
  • Invalid Inputs: 1 point each (Max 3)
  • Edge Cases: 1 point each (Max 3)

The Threshold:

  • Passing Score: > 6

The Execution: The AI returns 3 Valid, 3 Invalid, and 2 Edge cases.

  • Score: 3 + 3 + 2 = 8.
  • Threshold: 6.
  • Result: PASS.

Suddenly, your test suite isn’t red. It’s green. Why? Because the product did its job. It provided value. The scorecard reflects the reality of the quality, not just the strictness of the prompt.

Evolution: The Scorecard is Live Code

Here is the kicker: This scorecard isn’t static. Today, a threshold of 6 might be acceptable. But as your model improves, or as you refine your prompt engineering, you might raise that threshold to 8. Or you might add a multiplier for “Valid Cases” because they are more important.

This isn’t just “maintenance burden.” This is Quality Engineering. You are actively deciding what “Good Enough” looks like and codifying it into your suite.

Conclusion

Testing AI based products or agents, requires a fundamental shift in how we view automation. We are moving from checking strings to scoring behaviors. We are moving from “Pass/Fail” to “Good Enough.”

If you are still trying to use Assert.Equals on your LLM output, you are going to spend 2026 fighting your own test suite. And you’ll lose.

This shift from Binary to Scoring is exactly the kind of strategic thinking we want to encourage people to start using. That’s where my Captain’s Bridge comes in. Let’s stop fighting our tools and start leading our quality – strategy principles or practices from the trenches. join us in 2026.

Join The Captain Bridge

The post It’s not as bad as you think: Using scorecards in AI testing first appeared on TestinGil.
Read the whole story
alvinashcraft
24 minutes ago
reply
Pennsylvania, USA
Share this story
Delete

Announcing Capacitor 8

1 Share

Capacitor, our cross-platform native runtime for web apps, continues to grow rapidly in 2025, now nearing one million downloads per week and reaching a new weekly high of nearly 930,000 downloads in mid-November.

Today, we’re excited to announce the release of Capacitor 8 — the latest step forward in our ongoing effort to make building high-quality native experiences with web technologies simpler, more modern, and more consistent across platforms.

What’s New in Capacitor 8

SPM by default on iOS

Capacitor 8 adopts Swift Package Manager (SPM) as the default dependency manager for new iOS projects, replacing CocoaPods for new setups.

Existing CocoaPods-based projects will continue to work. While CocoaPods is still supported today, the iOS ecosystem is steadily moving toward SPM as the preferred package manager.

Learn more about SPM and iOS package management in Mark Anderson’s blog post: Swift Package Manager and Capacitor.

Android Edge-to-Edge support

Modern Android devices favor immersive, full-screen layouts. Capacitor 8 introduces built-in edge-to-edge support through a new internal SystemBars plugin that takes care of status and navigation bar appearance and insets automatically, so your layout always looks right on modern Android devices.

This same functionality powers the new public SystemBars API which gives developers access to fine-grained control when it’s needed. If you still need to support older versions that rely on @capacitor/status-bar, the two can be used together — Capacitor automatically applies the correct behavior based on the device’s Android version.

Updating to Capacitor 8

Capacitor 8 continues our ongoing modernization of the native layer across both iOS and Android, keeping your projects aligned with the latest platform standards.

When you’re ready to update, the Capacitor 8 Update Guide walks through the recommended upgrade path and any changes to be aware of.

Thank You!

A huge thank-you to the Capacitor team for their hard work and care in shaping this release, and to all of our community contributors whose bug reports, fixes, and feedback help us keep improving with each version. And of course, thank you to the broader Capacitor community for continuing to invest in and believe in the project. We’re excited to keep building the future of cross-platform development together.

The post Announcing Capacitor 8 appeared first on Ionic Blog.

Read the whole story
alvinashcraft
25 minutes ago
reply
Pennsylvania, USA
Share this story
Delete

Managing The Aspire Community Toolkit With AI

1 Share

In the middle of November Aspire 13 was released and with that came quite a few large changes that we would need to tackle in the Aspire Community Toolkit.

As the lead for the OSS project, I took on the responsibility of managing the release, which meant coordinating the various changes, ensuring compatibility with Aspire 13, and all the stuff that would go along with that. Ask any OSS maintainer and they’ll tell you that managing a release is a lot of work, especially one of this magnitude, and given that it’s not part of my core role at Microsoft, I had to find ways to be as efficient as possible with my time.

With this in mind, leveraging AI is a logical step to help streamline the process, and I want to share how I used GitHub Copilot for the various tasks involved in managing the Aspire Community Toolkit release.

By the numbers

Look at the milestone there was 12 PR’s that Copilot created for the release via Copilot coding agent, which were wither issues that Copilot was assigned to, or agent tasks I kicked off from agent HQ.

The largest of these PR’s was the .NET 10 upgrade with 48 comments from Copilot and reviewers. The simplest was probably dropping .NET from the branding.

For other work that was done, Copilot often played a role in the editor to help speed up writing code, but that doesn’t get captured as obviously as a PR.

The human in the loop

One of the challenges of the Community Toolkit is that it’s a very large solution, there’s almost 200 projects in the repo, and while they don’t necessarily have all that much code in them, the sheer size results in complexity.

As a result, Copilot is not always going to be “right” on the first pass through, and this is where the human comes into play.

Generally speaking, the process that was followed was:

  • Write up the issue or task that needed to be done.
  • Assign it to Copilot via the coding agent.
  • Review the PR that Copilot created.

During the review process, depending on the level of complexity I would either comment on the next iteration of changes that would need to be done, or check out the PR locally and pick up where Copilot left off. The latter is the more common of the scenarios, especially since we were updating to Aspire 13, which the models have no knowledge of, so trying to just prompt my way through it would have been a nightmare. In fact, here’s my local branches:

$ git branch | grep copilot
  copilot/adapt-connection-string-formatting
  copilot/add-dotnet-10-tfm-support
  copilot/add-influxdb-integration
  copilot/add-neon-integration
  copilot/add-stripe-cli-integration
  copilot/fix-772
  copilot/fix-821
  copilot/fix-mcpinspector-certificate-issue
  copilot/fix-otel-export-integration
  copilot/remove-addviteapp-and-withnpmpackageinstaller
  copilot/remove-deprecated-lifecycle-hook
  copilot/review-python-extensions
  copilot/support-alternative-package-managers
  copilot/update-addchatclient-sensitive-data-config
  copilot/update-eventstore-to-kurrentdb

They aren’t all from the release, but most are, and they are the branches I took over from Copilot to finish up.

Admittedly there are times where it’s more of a cursory glance at what Copilot has done, such as when it was removing .NET from the branding - that was just a quick pass over the PR changes and merging it in.

Improving success

Since the work for the release was going to be done against stuff that Copilot had no knowledge of we ran the risk of it either making up something that was completely incorrect, or just not being able to help at all. To help reduce this, I aimed to provide a reference to the relevant Aspire source code for a change.

Let’s take the removal of AddViteApp and WithNpmPackageInstaller methods as an example. These methods were moved from the Community Toolkit to the core Aspire repo, and when crafting the issue for that, it links to the PR that made the change in Aspire, so that Copilot could see the new API surface and update our code accordingly. That PR did still result in human interception and finalisation, but that was partially because I kicked off the PR before the changes in Aspire were merged, so Copilot was working off a draft of the changes.

Did it speed things up?

So the big question is - did doing this actually save any time? The answer is a resounding yes. As an OSS maintainer, the value for me was being able to kick off multiple parallel tasks to be worked on by Copilot, and then I could jump in for finalisation as required, while delegating more tasks to Copilot. It also allowed me to drop the really tedious stuff to Copilot, like the initial .NET 10 upgrade, which is really just modifying a bunch of MSBuild and yaml files, but then when we uncovered a problem with one of the projects not building correctly, I picked up that harder part of the task (which involved going through MSBuild source code and crash dumps - fun!).

The 13.0 release of the Community Toolkit came about 2 weeks after Aspire 13 was released, and while I can’t say for certain how long it would have taken without Copilot, I can say that it would have been significantly longer than 2 weeks.

Looking ahead

Copilot is going to continue to play a big role in how I manage the Aspire Community Toolkit. Anyone following the changes will see an ever growing number of PR’s being created by Copilot. In fact, I’ve created two custom agents in the repo that are designed to create new hosting and client integrations, allowing us to scale out the number of integrations we support. I also recently created a custom agent to write docs in the Aspire docs repo from our README files, meaning that we can ensure that our documentation is always up to date when integrations are created.

There’s always going to be a human in the loop for OSS management, but by leveraging AI we can make the process significantly more efficient, allowing us to focus on the harder problems that require human judgement, while letting AI handle the more tedious tasks.

Read the whole story
alvinashcraft
25 minutes ago
reply
Pennsylvania, USA
Share this story
Delete

What the heck is a `\\.\nul` path and why is it breaking my Directory Files Lookup?

1 Share

Null Device Banner

In the last few months my Markdown Monster Application Insights log has been inundated with a hard failure for lookups of a \\.\nul device error. In my logs this shows up as an error like this:

Null Device Error In Directory Listing
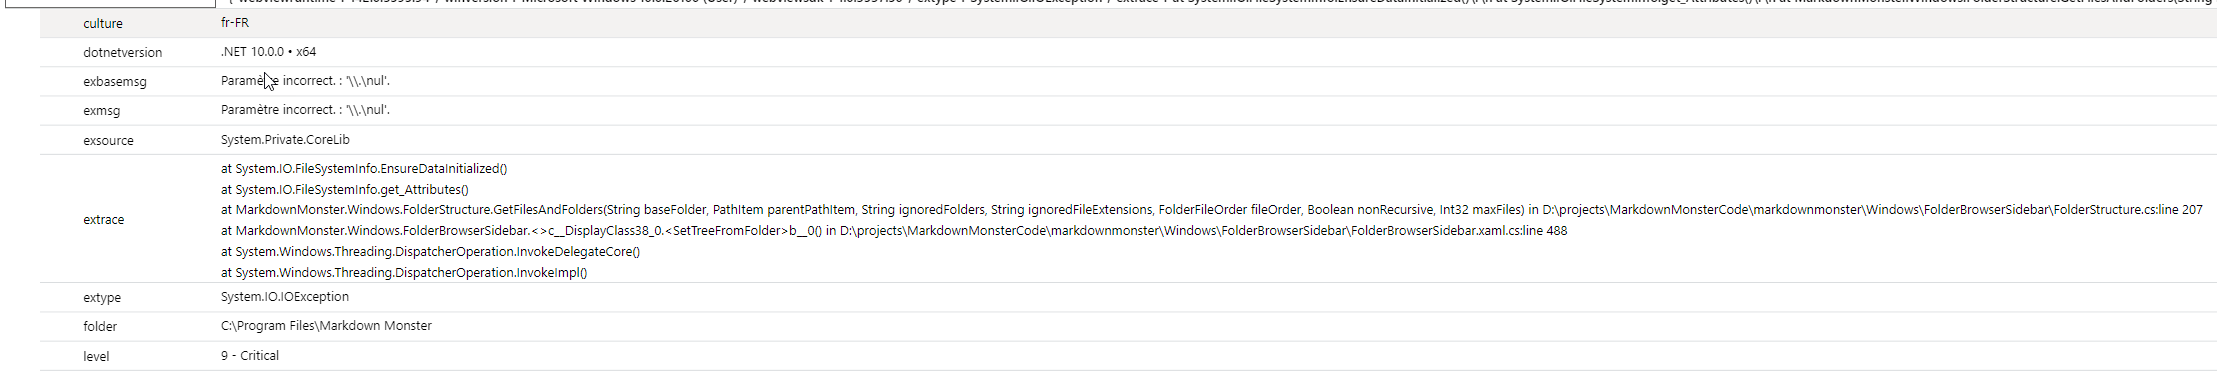
Figure 1 - Null device errors in the Application Insight logs

This error started creeping up in my logs a few months ago, and since then has gotten more frequent. The error always occurs in the same location in the code and it's related to the File and Folder Browser in MM that displays the files available on the file system.

File And Folder Browser In Markdown Monster
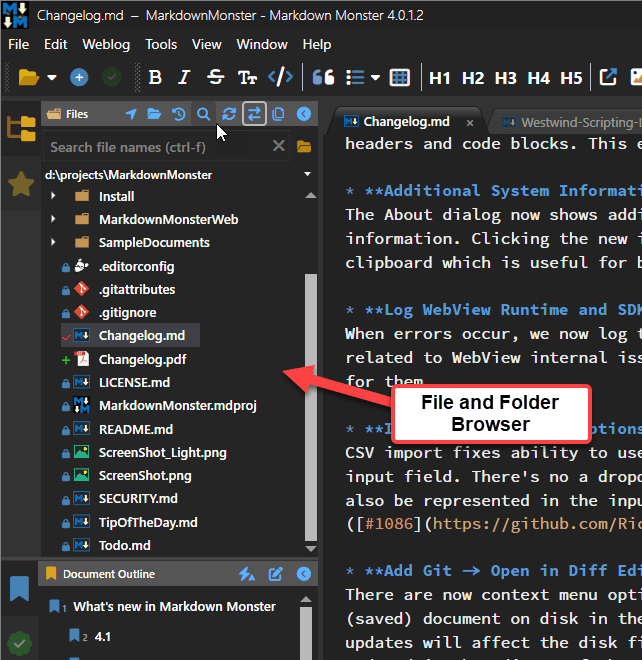
Figure 2 - The File and Folder Browser in Markdown Monster that is the target of the error

This is a generic file browser, so it's very susceptible to all sorts of oddball user configurations and mis-configurations and this particular error likely is of the latter kind. However, after doing a bit of research this is not an uncommon error - there are a number of references to this although the cause of it doesn't appear to be very clear and can be related to various different things.

In my use case, the error itself is triggered by doing a fileInfo.GetAttributes() call on a file name that was returned by the Directory.GetFiles() lookup originally. The file is not a 'regular' file but rather a 'device' and so GetAttributes() throws an exception. And yeah that's very unexpected.

Specifically the failure occurs here:

// System.IO Exception: Incorrect Parameter \\.\nul  
if (fileInfo.Attributes.HasFlag(FileAttributes.Hidden))
    item.IsCut = true;

This code sits inside of a loop that does a directory lookup then loops through all the files and adds them to the display tree model that eventually displays in the UI shown in Figure 1. The key is that the Attribute look up fails on this mystery 'null device' file.

This is doubly frustrating in that Attributes is an enumeration that apparently is dynamically evaluated so the only way to detect the invalid state is to fail with an exception. Bah 💩!

What the heck is \\.\nul?

My first reaction to this error was, yeah some user is doing something very unusual - ignore it. And yes, the error is rare, but there appear to be a number of different users running into this issue (oddly all are Eurozone users - so might be some specific software or AV).

I started looking into it more doing some LLM research.

The first response is what I pretty much got as a standard explanation of a null device:

Null Device Explanation
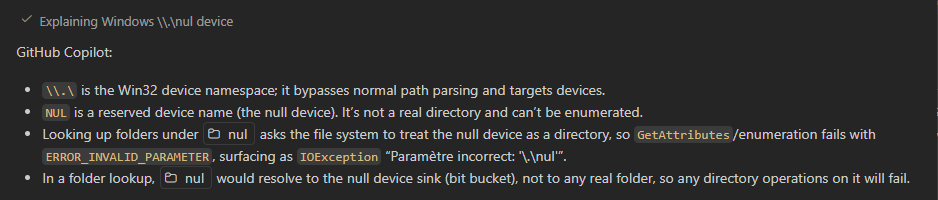
Figure 3 - Basic LLM definition of a null device in file context

Turns out nul refers to a the Windows nul device, which as the name suggests is a device sink that doesn't do anything. Apparently, it's meant to be used to pipe or stream STDIN/OUT to oblivion. I'm not sure how that would ever end up in a directory listing unless it's mapped through some weird symlink redirection. While symlink mis-configuration is not hard to do in Windows, it's odd that several users would end up with the same nul device error misconfiguration.

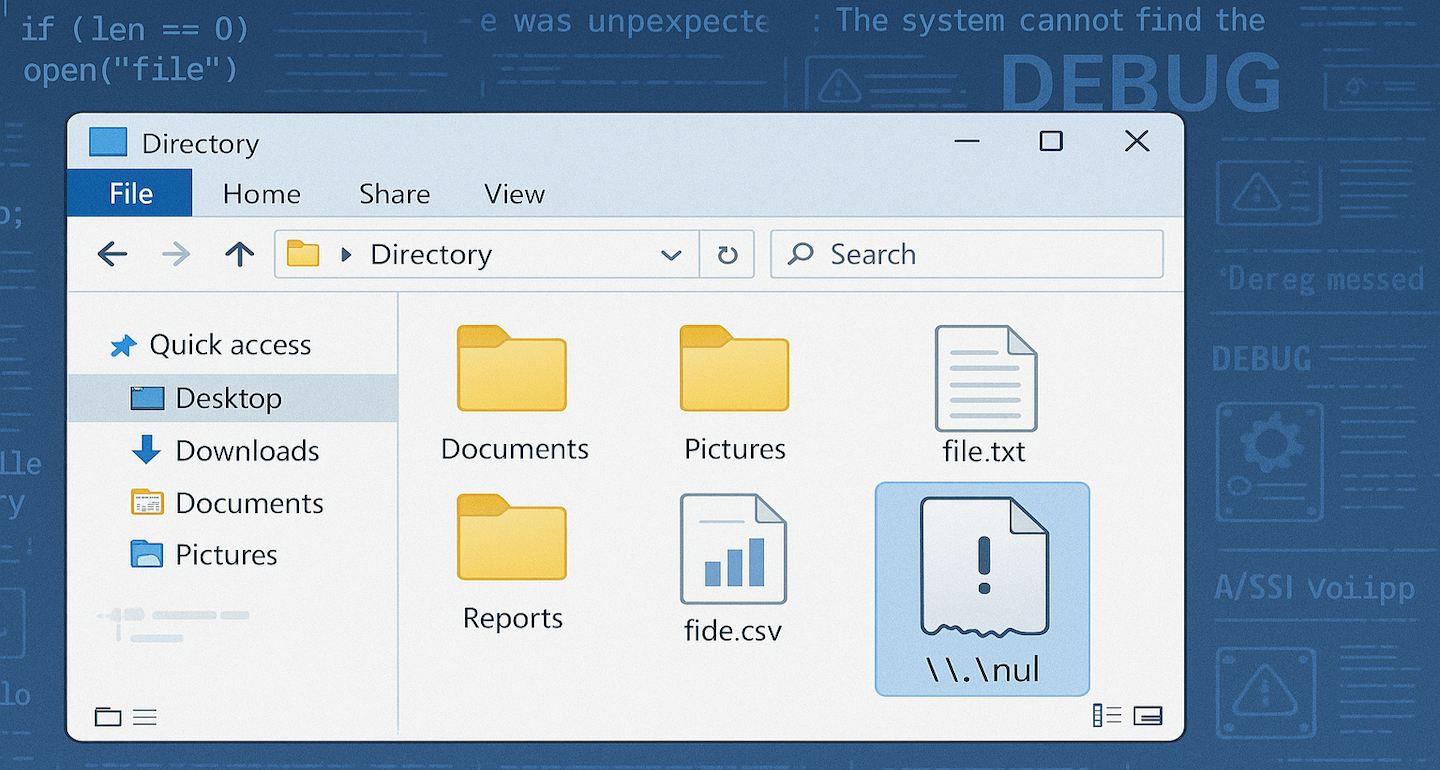
Furthermore it seems that Windows itself forbids creation of files or folders with the name of nul:

Nul Files Not Allowed In Windows
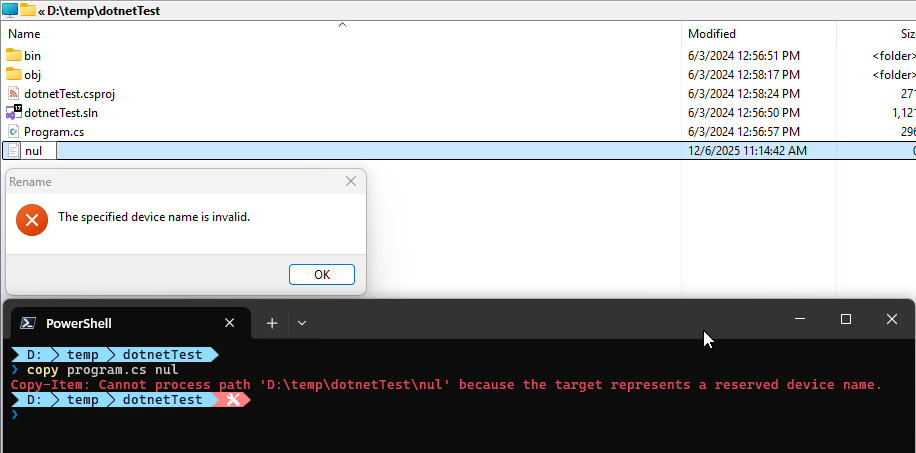
Figure 4 - nul files and folders can't be created in Explorer or the Shell

So - it's still a mystery to me how a \\.\nul entry can sneak into a directory file or folder listing.

The second prompt tries to unravel the file listing mystery, but the answer (similar for various other LLMs) is not very satisfying:
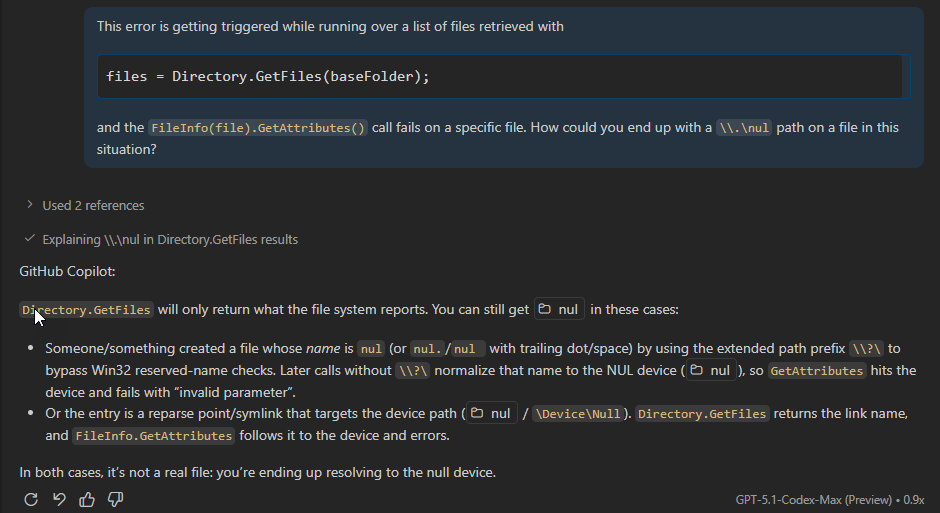
Null Files In Directory Listings
Figure 5 -

The first point is unlikely since we've already seen that it's rather difficult or impossible to create file or folder with the name of nul.

The latter is more interesting: Some sort of mis-configured symlink reference. However, I couldn't find a scenario where a symlink would do this. Doing directory listings on folders that have symlinked embedded folders (like Dropbox, OneDrive etc.) seems to work fine and returns those linked folders the same as normal folders and you can get attributes on those (although they are often empty).

But I suppose it's possible that a symlink could have an invalid reference to a nul file name. I didn't try this as surely I would mess something up irreversibly (as I always seem to do when manually messing with symlinks on Windows).

Working around

In the end I was unable to troubleshoot the exact cause of the problem, but given what we know there are workarounds at least.

So far since implementing the first of the two solutions I haven't seen the errors pop up any more in newer versions. However, I still see the older version errors which suggest that the users having these issues haven't gotten updated to newer code yet.

So here are the two workarounds I've used for this:

Bobbing for Apples - eh Errors

This falls into the simplest thing possible bucket:

My original solution before I completely understood the problem was to simply check for failure on the code that was failing and defaulting the value. This is a pretty obvious band-aid solution and it works. I haven't seen this error crop up in versions since this simple fix was originally made.

try
{
    if (item.FileInfo.Attributes.HasFlag(FileAttributes.Hidden))
        item.IsCut = true;
}
catch {
    // if we can't get attributes it's some device or map we shouldn't show
    item.IsCut = true;
}

The idea here is that if attributes cannot be retrieved the file cannot be a 'normal' file that should be displayed and we can safely omit rendering it.

Although this works it's always a little unsatisfying to fix things in this band-aid manner. Specifically because it might crop up elsewhere again - completely forgotten then. 😄

Filtered Directory Listings

The source of the problem really seems to be that the directory listing is retrieving device data in the first place.

It turns out the default Directory.GetFiles() filter mode is rather liberal in what it retrieves using the default EnumerationOptions instance:

File Info Get Attributes Default Enumeration Mode
Figure 6 - Default enumeration mode doesn't skip Devices

It only skips over hidden and system files, but allows everything else.

The \\.\nul error is caused by a Device map of some sort so skipping over devices might be useful.

So, rather than using the default directory listing, we can use explicit EnumerationOptions and skip over devices, like this:

string[] files = [];
try 
{
	var opts = new EnumerationOptions { AttributesToSkip = FileAttributes.Hidden |
	                                    FileAttributes.Directory | FileAttributes.Device |
	                                    FileAttributes.ReparsePoint | FileAttributes.Temporary};
	if (config.ShowAllFiles)
	    opts.AttributesToSkip =  FileAttributes.Directory | FileAttributes.Device |
	                             FileAttributes.ReparsePoint;
	files = Directory.Files(baseFolder, "*.*", opts);
}
catch { /* ignore */ }

foreach(var file in files) { ... }

Keep in mind that this is for a widely used generic implementation so there's a extra safety built in here with the try/catch to protect against invalid user provided folder names etc. from throwing out of the app. In that scenario there's no file list returned.

The code above should prevent devices and reparse points - which are likely the cause of the \\.\nul device errors I'm seeing in the log - to stop occurring as they are not being returned by the directory listing.

Summary

Since implementing this fix the logs have been clean of the errors. Since I never had a repro scenario I can only go off my logs though so I can't be 100% certain that the problem is solved, but using both the directory skip filter plus the exception handling around the Attributes retrieval most definitely should fix this issue.

To be clear this is a huge edge case for a very generic file browser solution that's going to get all sorts of weird shit thrown at it from many different types of users from power users to your grandma's file systems. In more controlled situations you probably don't have to worry about edge cases like this.

However, it's important to remember that there can be funky behaviors with filesystem behavior related to symlinks and remapped folders (like DropBox). For example, I just ran into an issue where FileInfo.Exists reports the Dropbox folder as non-existing where Directory.GetDirectory() does. IOW, symlinked files and folders can have odd behaviors and in those scenarios where you're dealing with symlinked file artifacts it might be a good idea to explicitly specify the file attributes to avoid unexpected failures that can't be easily handled with predictable logic.

© Rick Strahl, West Wind Technologies, 2005-2025
Posted in dotnet  
Read the whole story
alvinashcraft
25 minutes ago
reply
Pennsylvania, USA
Share this story
Delete
Next Page of Stories