The largest developer event of the year – Microsoft Build – is coming up and we are thrilled to announce the GitHub Challenge as part of the Microsoft Learn Challenge| Build Edition!Registrations are open – register NOW!
The GitHub Challenge is a 30-day learning adventure on Microsoft Learn! It’s completely free, super fun, with dynamic exercises. Dive in to master GitHub Copilot! Plus, you’ll create interesting adventures with Python and JavaScript while using GitHub Codespaces and create real-world projects with GitHub Copilot —just in time for Microsoft Build!This challenge starts on May 21st and ends on June 21st 2024.
As the world evolves, we want to help you grow and upgrade your skills! Get ready to level up with our exciting challenge. We’ve crafted this learning experience to boost your AI knowledge and turn you into a GitHub Copilot master!”
The GitHub Challenge on Microsoft Learn is available 24 hours a day, 7 days a week. You can learn at your own pace and when it is convenient for you.
After you complete this challenge before June 21st 2024, you will obtain a special and unique digital badge on your Microsoft Learn profile for completing this learning experience. This badge is exclusively available during this event, which is part of Microsoft Build— our largest developer event of the year.
Another exciting piece of news is that you can showcase your badge on LinkedIn! This way, you’ll be able to share your learning experiences with everyone during #MSBuild
Why GitHuband GitHub Copilot?
GitHubis your home platform where you can collaborate with teammates, fork projects, publish your own software, and share your work with the world! But wait, there’s more! Enter the new era of developer productivity with GitHub Copilot—it will help you to focus on what truly matters: your code.
GitHub Copilotis the world’s most widely adopted AI developer tool. It helps to maximize developer happiness, increases developers’ productivity and accelerates software development. Whether you’re starting out or you’re an experienced developer: it’s super important to know and understand GitHub. It is one of the most requested platforms in tech companies worldwide!
Here are 8 reasons why you should take this opportunity:
Quick skill acquisition: master GitHub Copilot capabilities with fun projects!
Expand your expertise: gain proficiency in AI-powered coding assistance.
Stay ahead in the tech world by learning cutting-edge tools.
Boost your profile: showcase your badge on your social media such as LinkedIn for professional recognition.
Networking opportunities: connect with industry peers with these experience on LinkedIn and here in the comment section!
Free access! Take advantage of this curated experience and opportunity to learn at no cost.
Hands-on experience: gain practical coding experience in a supportive learning environment.
Career advancement: increase your employability and stand out to potential employers with GitHub tools expertise.
5 Reasons to learn GitHub and GitHub Copilot:
Improve Collaboration: GitHub facilitates seamless teamwork and project management.
Version Control: Git/GitHub ensures organized code history and easy collaboration.
Industry standard: GitHub proficiency boost employability and credibility.
Efficiency: GitHub Copilot accelerates coding with AI-powered suggestions.
Innovation: GitHub Copilot free up time for developers to focus on creativity and problem-solving.
Immerse yourself in cutting-edge AI technology, build new skills, and earn a badge by completing one of these unique, AI-focused collections. Each challenge offers a variety of resources to help you succeed, including interactive Microsoft Learn community events, live and recorded learning sessions delivered by experts, and training assets. The challenge is on June 21, 2024, taking this unique time opportunity! Register here now: aka.ms/MSBuildChallenge
If you are passionate about AI, Data Engineering, Power Platform or Microsoft 365 discover and join the amazing learning experiences we have built just for you!
Join the conversation! Share your journey with us in the comments below. We would love to learn about your experience with the challenge, your future plans, and whether you’re a student, developer, entrepreneur, or all of the above!
If you've used GitHub Copilot before, please let us know in the comments about your experience and even if it's the first time you've heard about GitHub! We'd love to hear your favorite/funny stories from the times you've coded with GitHub Copilot!
Don't forget to share your progress and badge on LinkedIn or X (Twitter) using the hashtag #MSBuild!
Get Certified with GitHub - banner.
Get ready to put your GitHub Challenge knowledge to the test! We’re thrilled to announce our 4 Learn Live sessions in both English and Spanish, launching this summer in June. These we will help you prepare for the GitHub Foundations Certification. Registrations are open! aka.ms/GetCertifiedwithGitHub
And guess what? If you’ve registered for these sessions, there will be exciting surprises waiting just for you!Stay tuned right here on our blog, we’ll share all the amazing details very soon!
Dan Garfield is the Co-founder of Codefresh, a CI/CD platform powered by GitOps and Argo now acquired by Octopus Deploy. As the VP Open Source and Argo Maintainer, he works primarily on Argo CD and Argo Rollouts. He helped create the GitOps Working Group and Open GitOps Principles. He helped create the most popular GitOps certification with Argo CD and writes consistently about best practices for GitOps involving Security, Development processes, and scaling.
Topics of Discussion:
[2:37] Dan Garfield’s career journey and his interest in technology from a young age.
[4:17] The inspiration behind creating Codefresh.
[7:57] Going all in on Kubernetes.
[9:55] Meeting Paul, the CEO of Octopus.
[10:37] We’re still in the early days of Kubernetes.
[12:27] What’s the default choice for deploying to Kubernetes?
[15:08] The importance of unified software delivery.
[16:50] Linux native crowd adopted containers first, while .NET developers were slow to adopt due to compatibility issues.
[22:53] What does Argo CD do?
[25:04] GitOps Principles.
[29:28] Managing microservices in a dynamic infrastructure.
[32:29] Environment management, promotion workflows, and traceability.
[34:30] Where exactly the balance between Argo and CodeFresh fits in.
OpenAI and Google are back with some new AI models that can talk to each other! .NET Aspire is getting close to release and Xamarin end of life is here, so we reflect back.
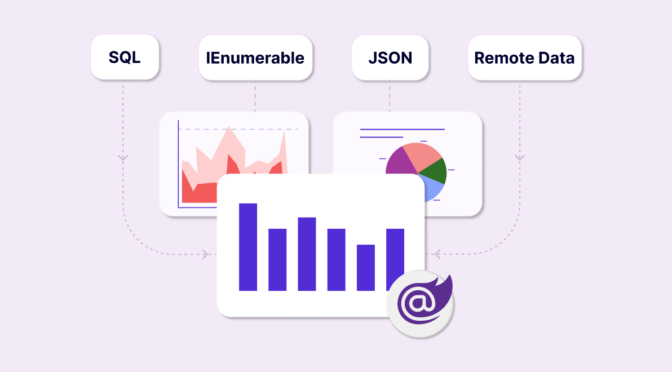
TL;DR: Learn to seamlessly load data from various sources into the Syncfusion Blazor Charts component. This blog explores its ability to integrate with different data sources, including IEnumerable, remote data, JSON, observable collections, and SQL. We’ll focus on loading IEnumerable data in Blazor Charts, specifically using list binding.
Charts are a powerful tool for visualizing data in an interactive and user-friendly manner. They can seamlessly integrate with different data sources, whether stored in a local array, a remote server, or a cloud-based database.
The Syncfusion Blazor Charts component is designed to elegantly visualize a large volume of data. It offers a rich feature set with functionalities like data binding, multiple axes, legends, animations, data labels, annotations, trackballs, tooltips, technical indicators, zooming, and more.
In this blog, we’ll provide a step-by-step guide on integrating the Blazor Charts with various data sources. Additionally, we’ll discuss three crucial properties of Blazor Charts that are essential for configuring the data:
DataSource: Collects the data points for the chart.
XName: Retrieves the x-axis value from the DataSource.
YName: Retrieves the y-axis value from the DataSource.
By the end of this tutorial, you’ll be creating dynamic and interactive charts that seamlessly update in real time whenever your data source changes.
Let’s get started!
Key data sources
Let’s explore the Syncfusion Blazor Charts, a versatile tool that supports various data sources for its components. The following are key data sources that it can seamlessly integrate with:
In the upcoming sections, we will explore these data sources in detail and see how they facilitate the process of loading data into Blazor Charts.
Loading IEnumerable data in the Blazor Charts
The IEnumerable data source is quite versatile. It supports all non-generic collections that can be enumerated, making it suitable for various scenarios.
Let’s populate the IEnumerable collection with predefined class properties. We will map the XName and YName properties, to the x-axis and y-axis fields of our Blazor Chart component, respectively.
The IEnumerable data source can accommodate various types of data collection. including:
In the upcoming sections, we will see how these collections can be used with the IEnumerable data source in Blazor Charts.
List binding
Blazor Charts is a powerful data visualization component that enables you to display various charts in your Blazor apps. One common requirement is to populate the charts with data from a list. This article will explore how to populate list data for the Blazor Chart component.
Step 1: First, let’s create a class called Patient to represent the data we want to display in the chart. It will load data from patients’ names and their corresponding height details. Refer to the following example of the Patient class.
public class Patient
{
  public Patient(string currentName, double currentHeight)
     {
       Name = currentName;
       Height = currentHeight;
     }
       public string Name { get; set; }
       public double Height { get; set; }
}
Step 2: In your Blazor component, you need to define a property PatientData of type List<Patient> to store the list of patient details. You can populate this list with patient details from your data source or other preferred method. Refer to the following example for defining the PatientData property in your Blazor component.
Step 3: Now, we can bind the PatientData property populated with the patient details to the DataSource property of the Blazor Charts. This property is responsible for providing the data to the chart. Refer to the following example for bind the list data collection to the DataSource property.
You can use dynamic objects such as ExpandoObject to populate the charts with data. This section will explore how to populate ExpandoObject data for the Blazor Charts component.
Step 1: First, create an array to store the patient data. This example will load data from patients’ names and corresponding height details. Refer to the following example for defining the array.
Step 2: In the Blazor component, define a property PatientData of type List<ExpandoObject> to store the patient data. You can populate this list dynamically by creating ExpandoObject instances and setting the appropriate properties. Here’s an example of populating the PatientData property in your Blazor component.
public List<ExpandoObject> PatientData { get; set; } = new List<ExpandoObject>();

protected override void OnInitialized() {
   PatientData = Enumerable.Range(0, 6).Select((x) => {
       dynamic data = new ExpandoObject();
       data.Name = patientsName[x];
       data.Height = patientsHeight[x];
       return data;
   }).Cast<ExpandoObject>().ToList<ExpandoObject>();
}
Step 3: Now, we can bind the list of ExpandoObjects to the DataSource property of the Blazor Charts.
You can also use dynamic objects to populate the Blazor Charts with data.
Step 1: First, create an array to store the patient data. The step is similar to ExpandoObject binding.
Refer to the following example, where we will load data in the form of patients’ names and their respective height details. Here is an example of how you can define the array.
Step 2: To populate the patient details dynamically, create a custom class called DynamicDictionary that inherits from DynamicObject. This class enables us to set and retrieve properties during runtime dynamically.
You can define a list of DynamicDictionary objects to hold the patient data. In the OnInitialized method, you can populate this list by creating new instances of DynamicDictionary and setting the properties dynamically.
public class DynamicDictionary : DynamicObject
{
   Dictionary<string, object> dictionary = new Dictionary<string, object>();
   public override bool TryGetMember(GetMemberBinder binder, out object result)
   {
            string name = binder.Name;
            return dictionary.TryGetValue(name, out result);
   }
   public override bool TrySetMember(SetMemberBinder binder, object value)
   {
            dictionary[binder.Name] = value;
            return true;
   }
   public override System.Collections.Generic.IEnumerable<string> GetDynamicMemberNames()
   {
         return this.dictionary?.Keys;
   }
}
public List<DynamicDictionary> PatientData = new List<DynamicDictionary>() { };

protected override void OnInitialized()
{
   PatientData = Enumerable.Range(0, 5).Select((x) =>
   {
       dynamic data = new DynamicDictionary();
       data.Name = patientsName[x];
       data.Height = patientsHeight[x];
       return data;
   }).Cast<DynamicDictionary>().ToList<DynamicDictionary>();

}
Step 3: To bind the DynamicObject data collection to the DataSource property, you can use the <ChartSeries> tag to configure the series for the chart. Set the DataSource property to the list of DynamicDictionary objects. The XName and YName properties map the datasource field names for the chart’s X and Y axes.
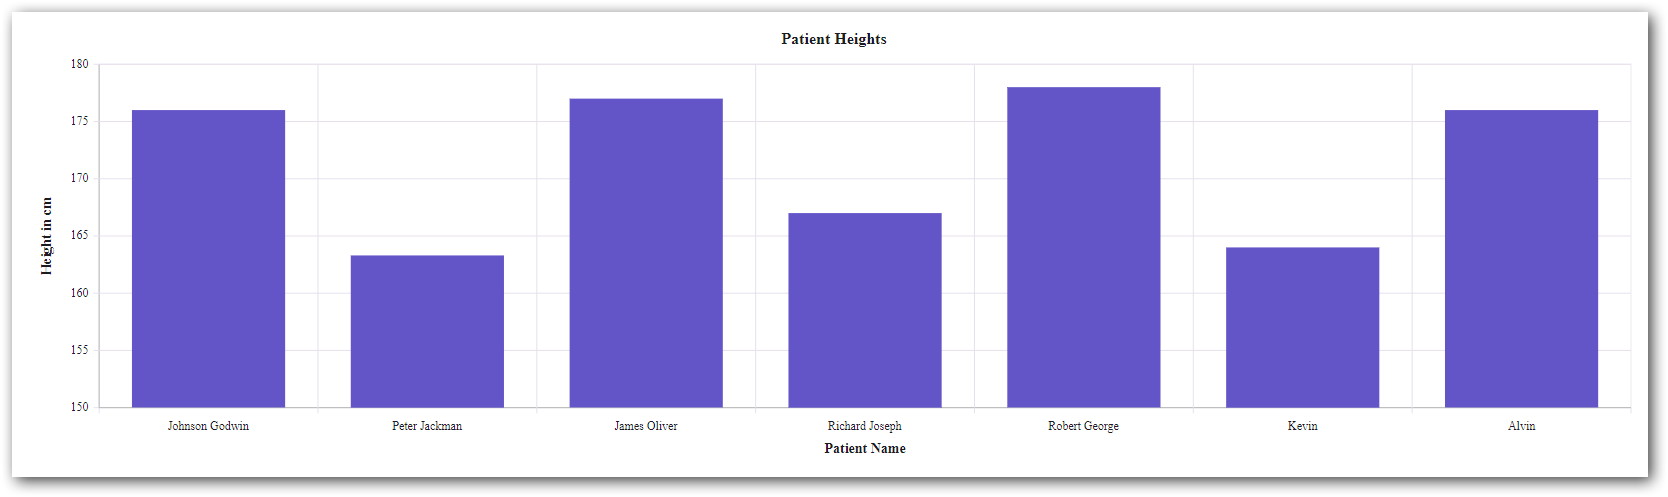
The following chart showcases the effectiveness of utilizing various data-populating methods discussed earlier. The chart remains consistent despite the differences in the implementation steps, whether using a List, ExpandoObject, or dynamic objects.
Loading list data in Blazor Charts
Loading remote data in the Blazor Charts
Blazor Charts can easily handle remote data by using Syncfusion.Blazor.Data package. To bind remote data to the chart, you can assign the service data as an instance of the SfDataManager class to the DataSource property. To communicate with a remote data source, specify the endpoint URL and choose the appropriate adaptor type based on your data.
In the following example, we will fetch data from a specific URL and use the Web API Adaptor.
Step 1: Include the following namespaces to use the SfDataManager class and adapters.
Step 3: Next, within the Chart component, configure the ChartSeries by setting the XName and YName values to map the appropriate properties from the remote data. Additionally, specify the desired chart series type as follows.
The following image shows the chart rendered using the remote data.
Loading remote data in the Blazor Charts
Loading JSON data in the Blazor Charts
JSON (JavaScript Object Notation) is a lightweight data-interchange format that allows for structured data storage. Like other data formats, you can map the locally converted field names to the XName and YName properties of the Blazor Charts.
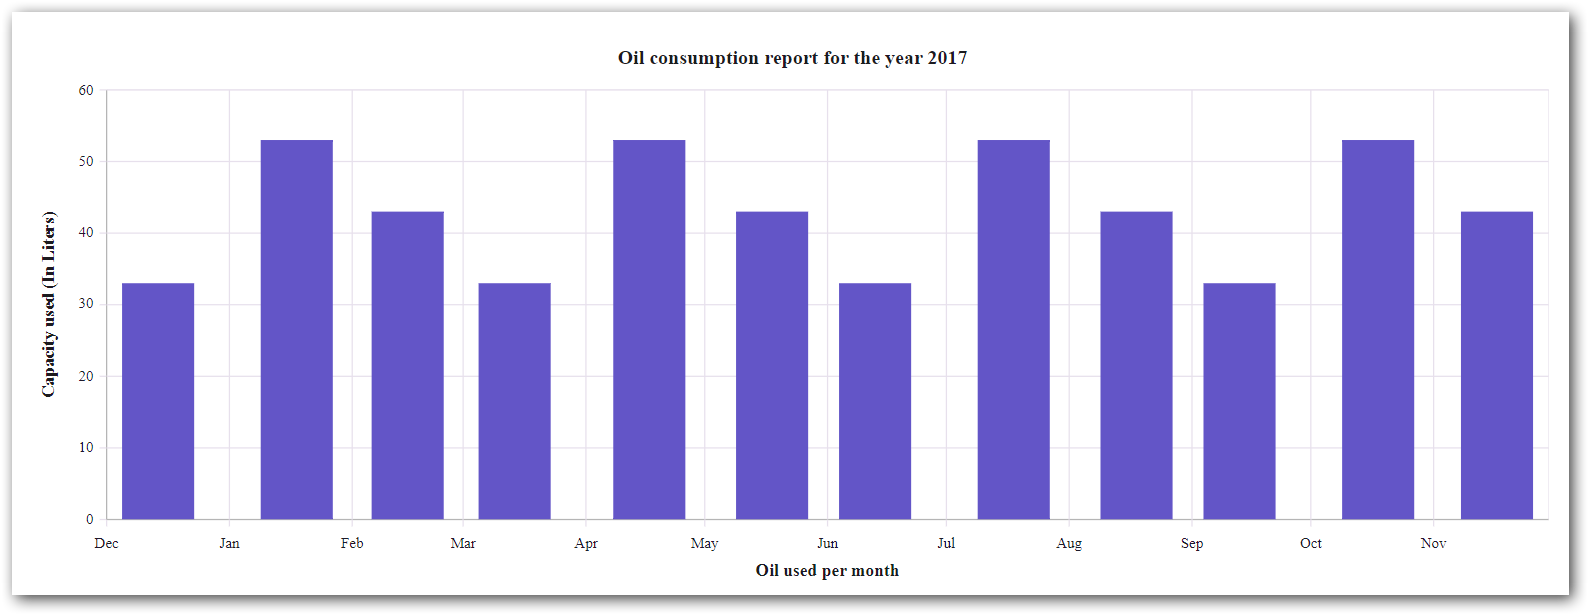
Let’s see how to bind JSON data for monthly oil consumption to the chart.
Step 1: First, deserialize the JSON data into your local business object, OilDetail.
In the following example, the classes HttpClient and NavigationManager are injected into our Blazor component.
Step 2: Now, bind the deserialized JSON data stored in the OilData property of the Blazor Charts component.
<SfChart Title="Oil consumption report for the year 2017" Theme="Syncfusion.Blazor.Theme.Material3">
 <ChartPrimaryYAxis Title="Capacity used (In Liters)">
 </ChartPrimaryYAxis>
 <ChartPrimaryXAxis ValueType="Syncfusion.Blazor.Charts.ValueType.DateTime" Title="Oil used per month">
 </ChartPrimaryXAxis>
 <ChartSeriesCollection>
  <ChartSeries DataSource="@OilData" XName="Date" YName="CapacityUsed" Type="ChartSeriesType.Column">
  </ChartSeries>
 </ChartSeriesCollection>
</SfChart>
Refer to the following image.
Loading JSON data in the Blazor Charts
Loading observable collection in the Blazor Charts
The ObservableCollection class in Blazor provides notifications when items are added, removed, or moved, making it ideal for creating observable charts. By implementing the INotifyCollectionChanged interface, the ObservableCollection also provides notifications for dynamic changes such as adding, removing, moving, and clearing the collection.
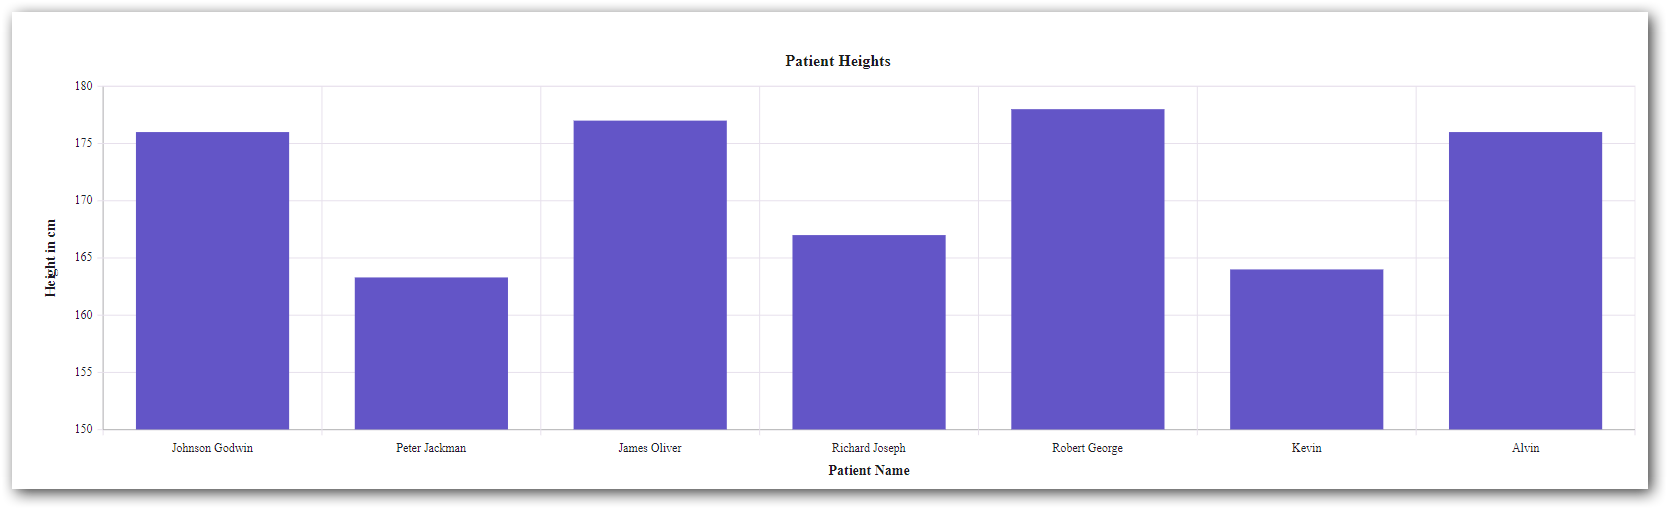
In this section, we will create a dynamic column chart using an ObservableCollection to display patient heights.
Step 1: To populate the chart with patient height details, define the PatientDetail class with Name and Height properties as follows.
public class PatientDetail
{
        public string Name { get; set; }
        public double Height { get; set; }
        public static ObservableCollection<PatientDetail> GetData()
        {
            ObservableCollection<PatientDetail> ChartPoints = new ObservableCollection<PatientDetail>()
            {
                new PatientDetail { Name = "Johnson Godwin", Height = 176 },
                new PatientDetail { Name = "Peter Jackman", Height = 163.3 },
                new PatientDetail { Name = "James Oliver", Height = 177 },
                new PatientDetail { Name = "Richard Joseph", Height = 167 },
                new PatientDetail { Name = "Robert George", Height = 178 },
                new PatientDetail { Name = "Kevin", Height = 164 },
                new PatientDetail { Name = "Alvin", Height = 176 },
            };
            return ChartPoints;
        }
}
Step 2: To bind the patient data to the chart, set the PatientData property to the collection returned by the GetData method. This can be achieved using the OnInitialized lifecycle method or any appropriate event handler.
Step 3: Finally, we bind the PatientData ObservableCollection to the Chart’s DataSource property. We map the XName and YName properties to the Name and Height fields from the PatientDetail class.
Loading observable collection data in the Blazor Charts
Loading SQL data in Blazor Charts
SQL provides a standardized way to interact with databases, execute queries, and perform operations like creating tables, defining relationships, and extracting meaningful insights from data.
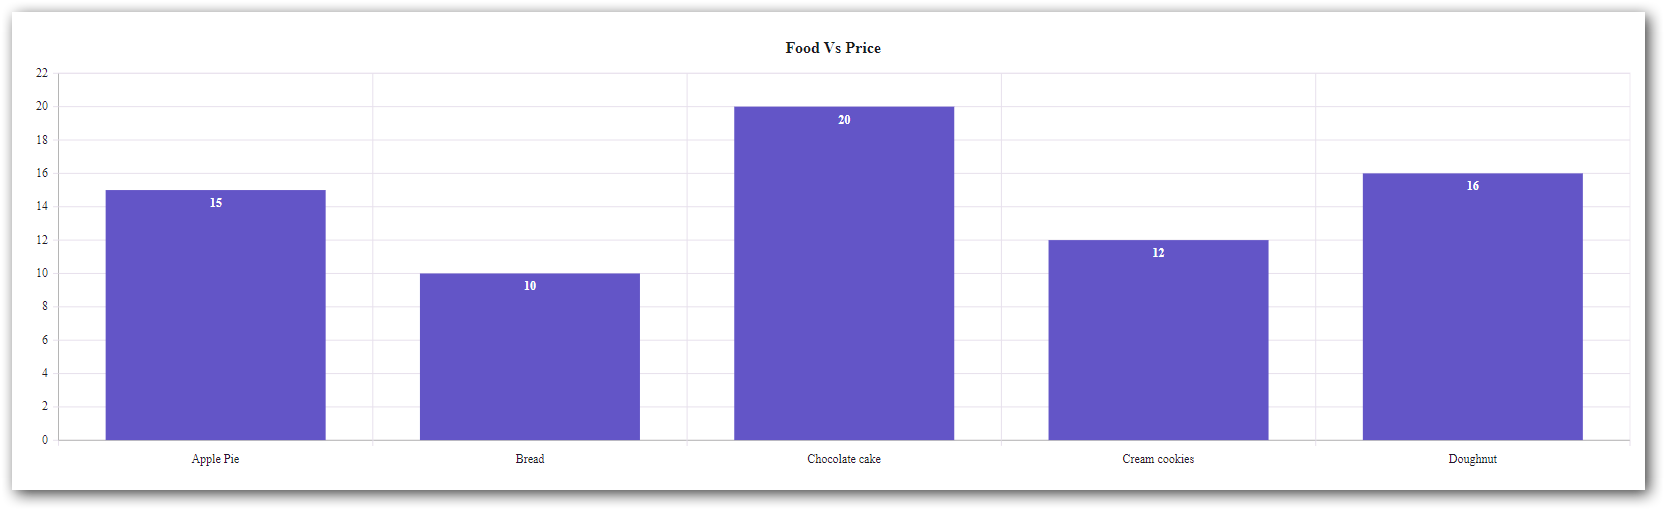
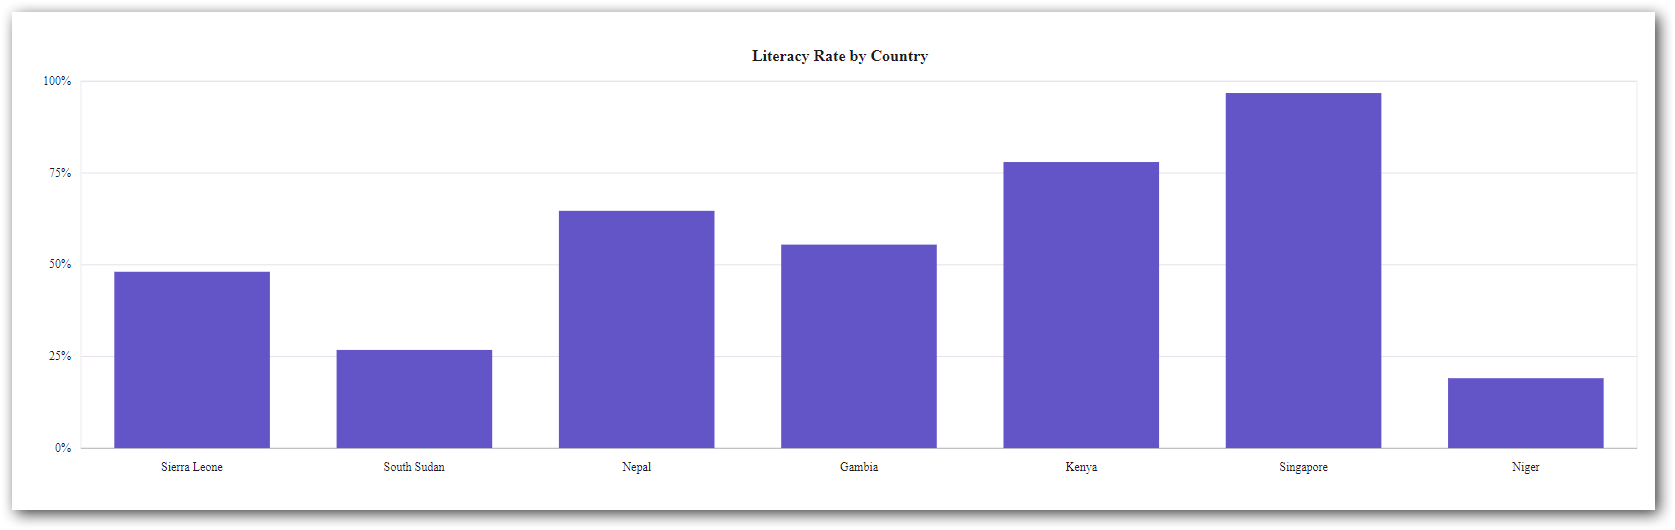
This section will explore how to create a column chart in a Blazor app by fetching data from the SQL table. This chart displays the literacy rate of multiple countries.
Step 1: First, create a model class named LiteracyRateModel that represents the structure of your SQL table.
public class LiteracyRateModel
{
    public string Country { get; set; }
    public double Rate { get; set; }
}
Step 2: Import the necessary namespaces and define a property to store the fetched data.
Step 3: Then, establish a connection to the SQL database, query the table, and read the data into the component’s data property.
protected override async Task OnInitializedAsync()
{
   string connectionString = "Your SQL connection string";
   string query = "SELECT * FROM Your Table Name";
   using (SqlConnection connection = new SqlConnection(connectionString))
   {
     await connection.OpenAsync();
     using (SqlCommand command = new SqlCommand(query, connection))
     {
       SqlDataReader reader = await command.ExecuteReaderAsync();
       if (reader.HasRows)
       {
         LiteracyRateDetails = new List<LiteracyRateModel>();
         while (await reader.ReadAsync())
         {
           LiteracyRateModel record = new LiteracyRateModel
           {
             Country = reader.GetString(1),
             Rate = reader.GetDouble(2),
           };
           LiteracyRateDetails.Add(record);
         }
       }
       await reader.CloseAsync();
     }
     await connection.CloseAsync();
   }
}
Step 4: Finally, bind the fetched data property (LiteracyRateDetails) to the chart’s DataSource property. Map the XName and YName properties to the Country and Rate fields from the LiteracyRateModel class.
Refer to the following chart, which displays the literacy rates of multiple countries in a column chart.
Loading SQL Data in Blazor Charts
Blazor Charts component enables developers to visualize data from different data sources. Their flexibility allows for tailored approaches based on specific requirements. Experiment with different data-populating methods to find the optimal solution for your project. Blazor Charts offers endless possibilities for creating engaging and dynamic chart visualizations.
GitHub reference
You can check out the complete code example from this article on GitHub.
Conclusion
Thank you for reading! In this blog, you have seen how to load data from various data sources in Blazor Charts. Try them out and leave your feedback in the comments section below!
Explore our Blazor Chart examples to learn more about the supported chart types and how easy it is to configure them for stunning visual effects.
The latest version of the Blazor Charts component is available for existing customers from the License and Downloads page. If you are not a Syncfusion customer, try our 30-day free trial.

.png")
.png")
.png")
.png")
.png")
.png")