Happy August folks. Louisiana is celebrating the approach of Fall by gradually increasing the temperatures to roughly that of the surface of the sun. Last night we saw the new Spider-Man, which was really good, although not as fantastic as "No Way Home". The point of these posts is for me to share content from other folks, but I'll remind folks of my Youtube channel. This past week I shared a few new videos demonstrating some cool stuff with Cursor so if you've not checked them out yet, give me a quick watch and let me know what you think!
First up is a great post by Vale detailing the capabilities and history of web browsers on game consoles. I've been playing on consoles since the very beginning and a lot of this was still new and surprising to me. Honestly I can't imagine surfing any web page on a browser now. I think the last time I did was on my XBox so I could find a cool background picture.
Next up is a cool JavaScript library for audio visualization, wavesurfer.js. Also I think this is the first site I've seen on the xyz TLD. The library works pretty simply - point it at a div and MP3 and it visualizes it on your web page. Here's a simple example of it in action.
Ah, the good ole days, hand crafting HTML in Notepad and manually "deploying" via carefully selecting and uploading via an FTP client. In the following few decades things got... a little bit more complex. This great deep dive by David Poblador i Garcia goes into detail over the changes in frontend. Those of you new to this - you missed a lot. ;)
With AI being everywhere, I'm curious how many of my readers ever saw Electric Dreams, an incredibly corny 80s film I remember watching on VHS over and over again. The story is... well... it was the 80s so that gives you an idea, but it had a pretty good songs in it including the main theme. Enjoy!
Microsoft is quietly testing a new Print Management app for Windows 11 and it appears to be another step in the company’s broader push to move older parts of the operating system to modern WinUI 3-based experiences.
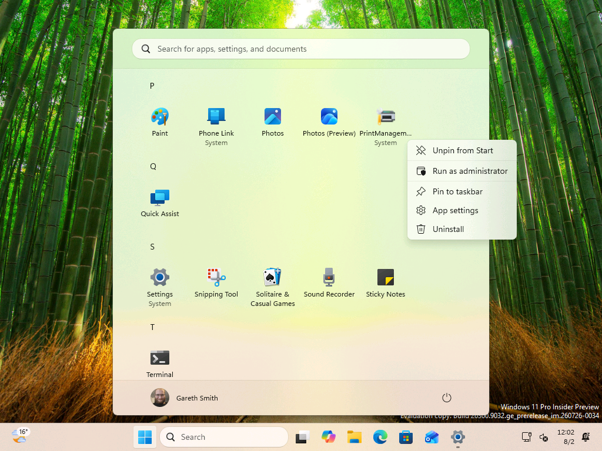
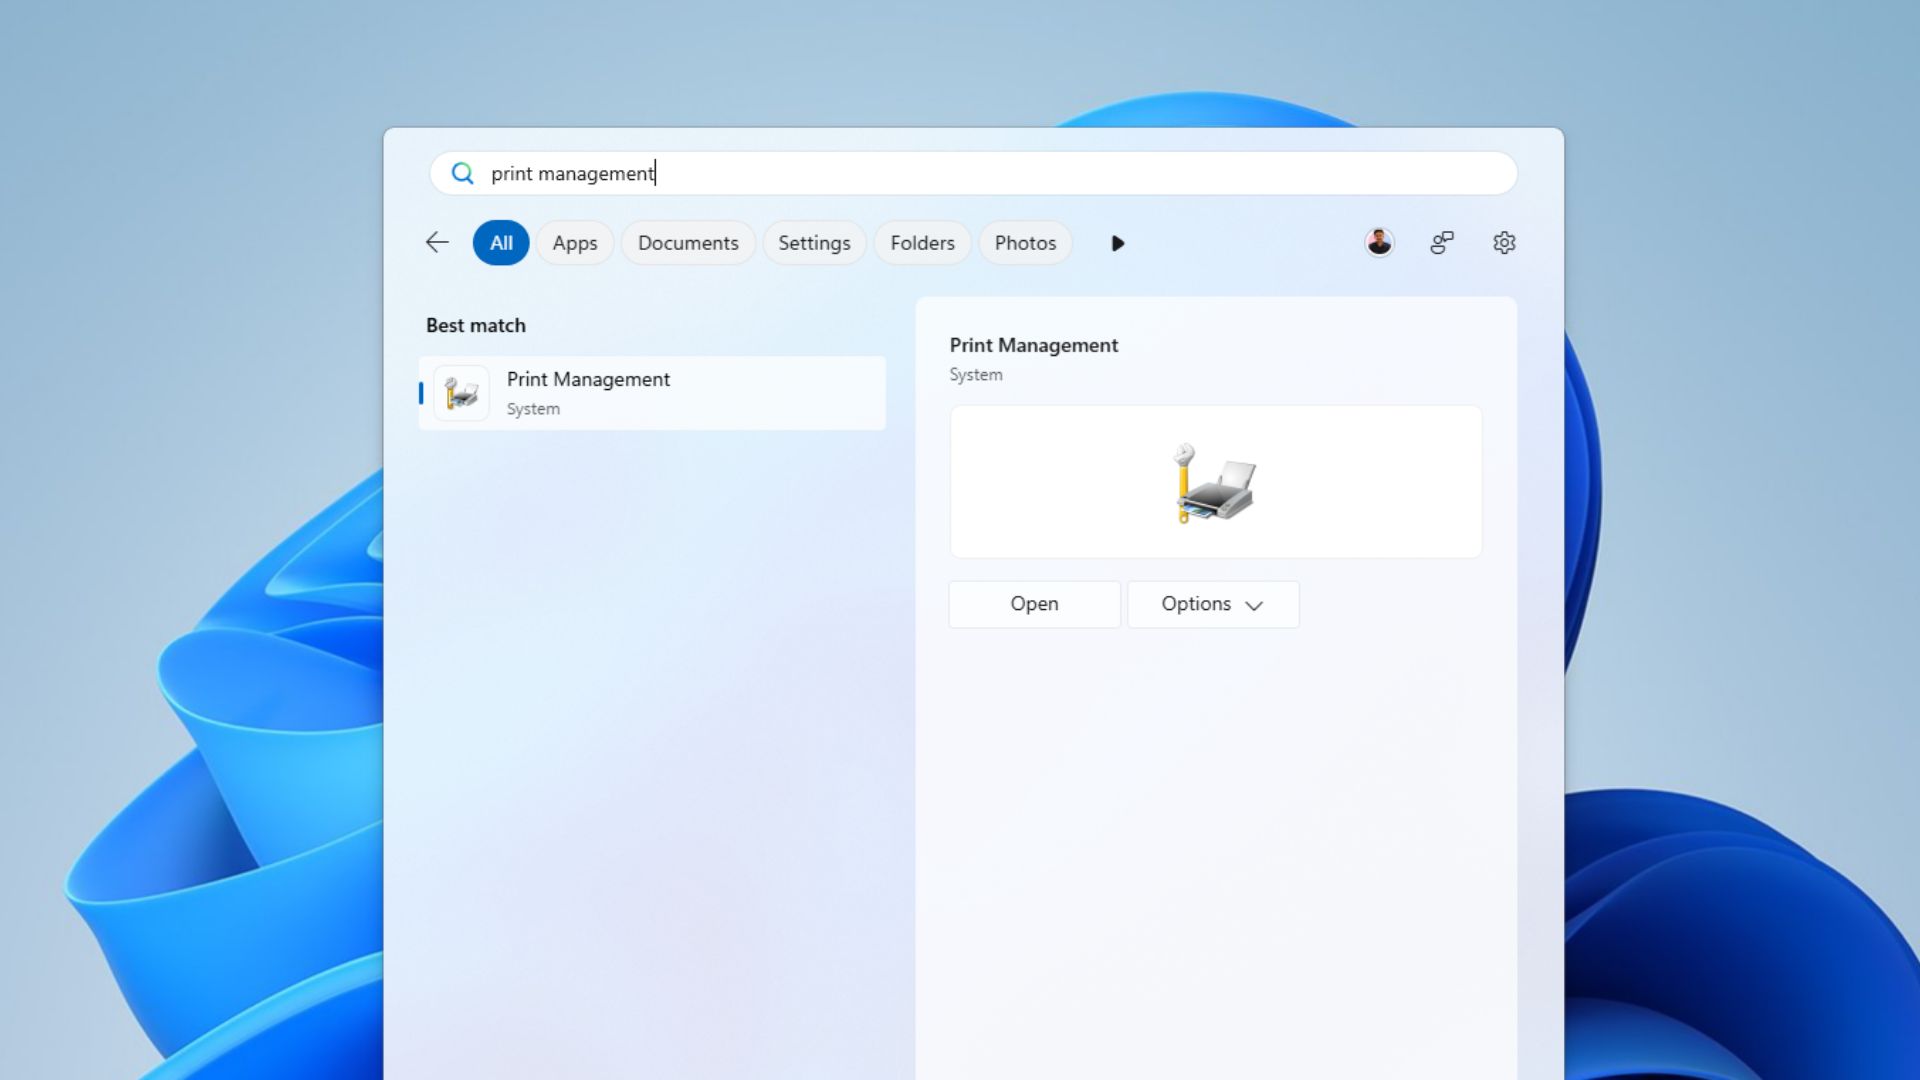
Print Management in the Apps list
In short, the new app is not just a fresh coat of paint for printer settings. It shows Microsoft experimenting with how deeper Windows administration tools could move away from legacy MMC-style interfaces and into the same WinUI 3 direction now being used across more of the Windows shell. Windows Latest recently reported on the UI redesign push, where Microsoft confirmed it is dumping legacy code across the shell in favor of WinUI.
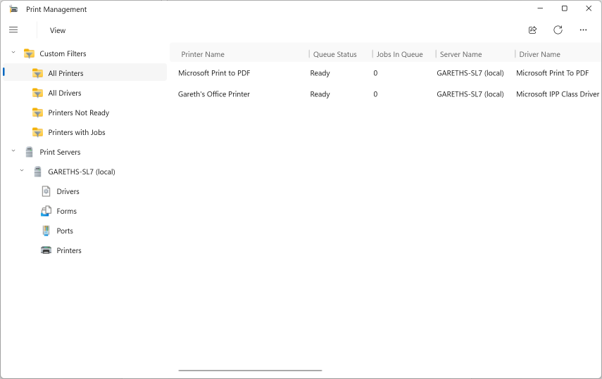
Print Management App Main View
At the time of writing, the app only appears in the Germanium-based Beta and Experimental Windows Insider builds and I was among the first to spot it there. It currently sits alongside the existing Print Management tool, which is still based on the Microsoft Management Console. Microsoft has not announced it as a full replacement, but the new app looks like an early attempt to bring printer administration into the same design direction as the rest of Windows 11.
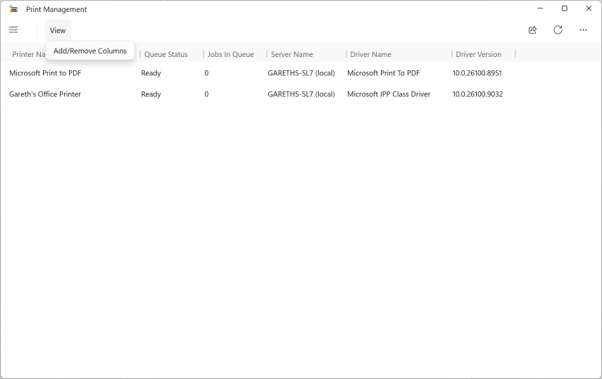
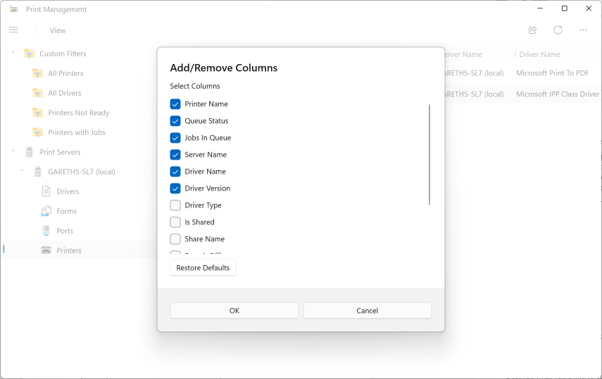
Print Management App with menu collapsed and opening the view menuAn example of a modern dialog in the appAdd or remove columns options
Unlike the legacy MMC snap-in, the new Print Management experience is packaged as a standalone Windows app under MicrosoftWindows.Client.CBS in SystemApps and it is not running in MMC directly. It is not currently listed inside the Windows Tools folder. Instead, it appears as a top-level entry in the All apps list, which makes it look and feel more like a regular Windows 11 app than a hidden administrative console.
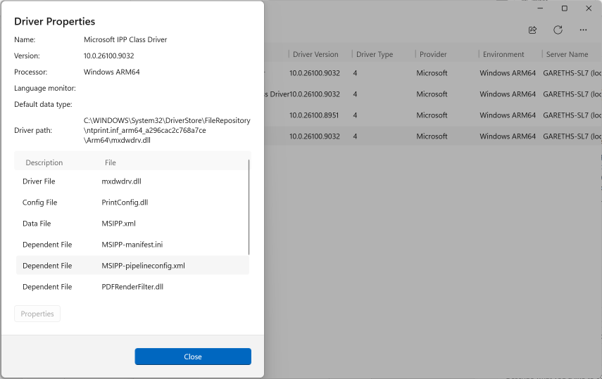
Driver Properties dialog has been updated too.
You still need to manually run it as administrator
There is one catch. At the moment, users need to right-click the app in the All apps list and select “Run as administrator” to open it properly. From what is visible in current builds, the executable requires admin rights, but the CBS package manifest does not appear to allow the app to request elevation automatically. That means the user has to launch it with administrator privileges manually.
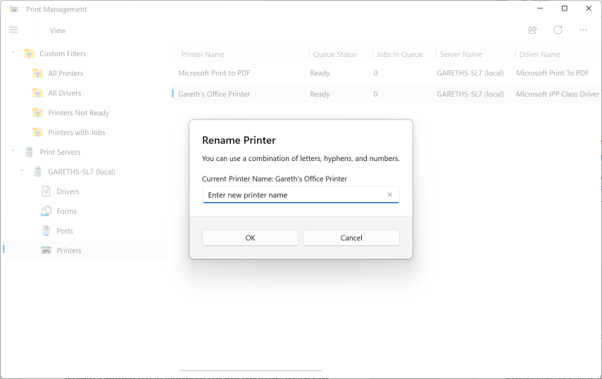
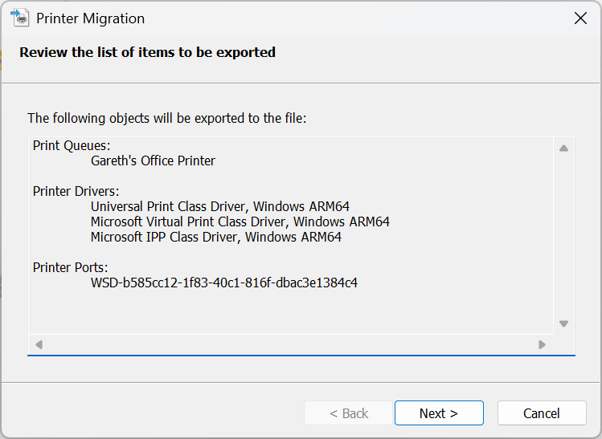
An example of a dialog in the app that hasn’t been modernized yet.
This is why the app currently feels like an unfinished bridge between old and new Windows. It is modern enough to appear as a normal Start menu app, but still depends on old-style administrative behaviour. We also noticed that the experience is not fully consistent yet: some dialogs appear to have updated interfaces, while others still open older legacy windows.
Microsoft’s plan to rebuild Windows 11’s legacy dialogs
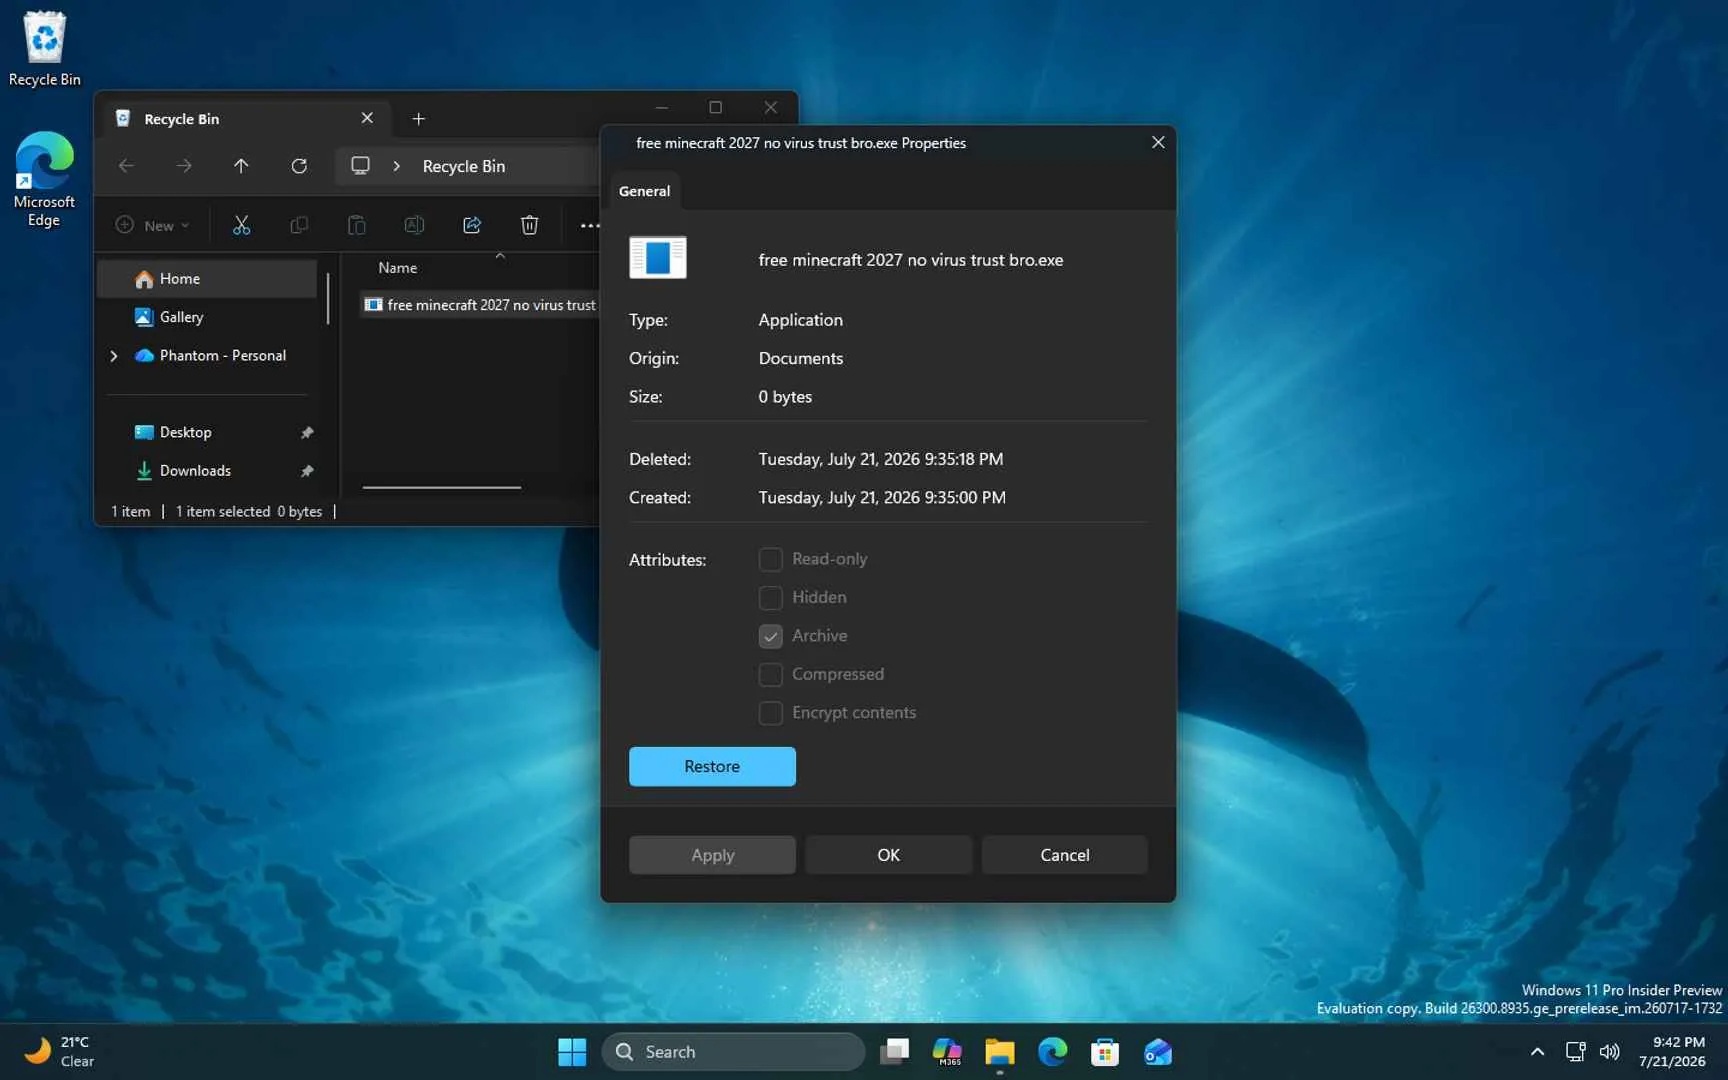
The timing is interesting because Microsoft has been more open recently about its plans to refresh older parts of Windows. In one post on X, a Windows team member said: “The file properties dialog in File Explorer was rebuilt in WinUI3. We do have a few places where we implemented dark mode support in the legacy UI as a low risk quick fix, but our plan is to bring more of the Windows UI to WinUI3.”
In another post, made while discussing File Explorer, they added: “We are working through our list of all older dialogs and rewriting them in WinUI3. The file copy dialog is already done, the common file dialog is on our list.” That is a notable comment, because although the immediate context was File Explorer, it suggests Microsoft is not just applying dark mode to old dialogs where it can, but actively rebuilding some of them using newer Windows UI technology.
A modernised Autoplay dialog also appears to be part of this wider work. After a request in May for Autoplay to be refreshed, Marcus Ash from the Windows team indicated that it was happening and said he was looking forward to the day he could tag the user in an announcement about it. Recently, Windows chief Pavan Davuluri confirmed that Autoplay is among the areas coming to Windows Insider Preview Experimental builds in a blog post on the Windows Blog and on X.
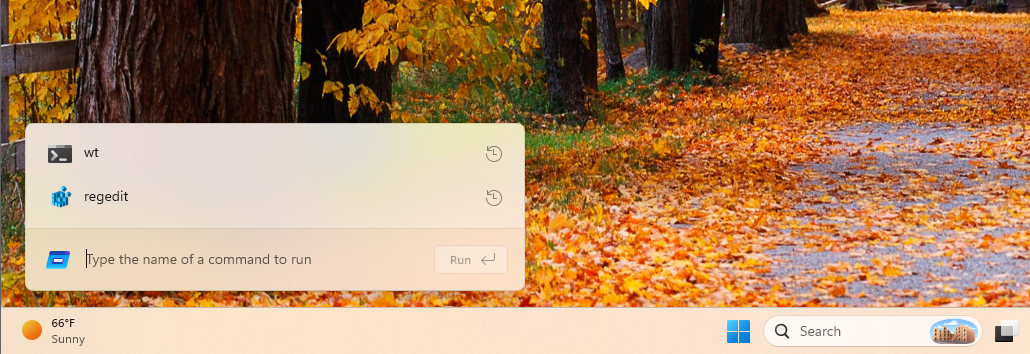
Davuluri said Microsoft has “strengthened the fundamentals of WinUI 3” and extended it into more of the Windows shell, including Widgets and the new Run experience. He also mentioned that the Autoplay dialog and more File and Folder Properties dialogs are coming soon to Experimental builds, with memory efficiency and latency improvements helping to support the wider modernisation of Windows 11 and the app ecosystem.
That context makes the new Print Management app more interesting. On its own, a redesigned printer tool may not sound like a major Windows 11 feature, but it points to something bigger: Microsoft is starting to tackle the deeper and less glamorous parts of Windows that still carry decades of old design language.
Windows 11 has a problem with UI consistency
Windows 11 still has an obvious consistency problem. Modern Fluent Design pages often sit next to older Win32, Control Panel, and MMC-era interfaces, sometimes only one click apart. At this point, it would not be entirely surprising if even long-forgotten Windows components such as dialer.exe eventually received the same treatment. Rebuilding these areas in WinUI 3 could help make Windows feel less like a mix of different generations of UI and more like one coherent operating system.
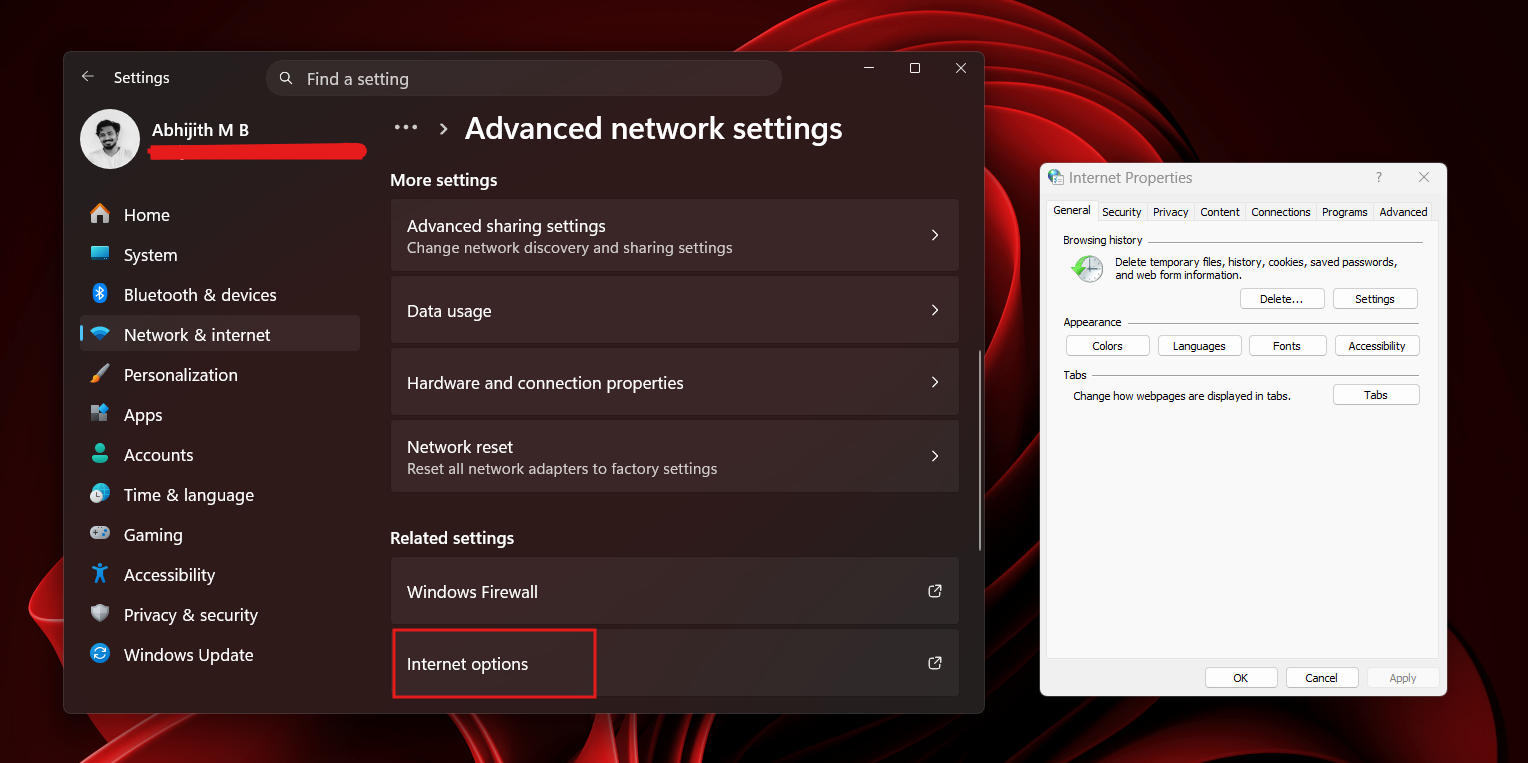
Some network settings are still tied to the Control Panel
It also matters for IT admins and power users. Print Management is still useful for managing printer queues, drivers, ports, and shared printers, especially in businesses, schools and other environments where printing infrastructure remains important. If Microsoft is willing to modernise a tool like this, it suggests the company is looking beyond flashy consumer-facing changes and paying attention to the administrative tools people still rely on.
From a quick look, most of those older Print Management features still appear to be there, including access to printers, drivers, ports, and related management options. That is important, because a modern redesign would be much less useful if it came at the cost of the practical tools admins already rely on.
What’s next for Print Management and Windows 11’s redesign
For now, it is worth treating the new Print Management app as an early Insider feature. Microsoft could change it, remove it, delay it, or decide to keep the MMC-based version alongside it. But its appearance lines up with the company’s recent comments about WinUI 3, older dialogs, Autoplay, File and Folder Properties, and the ongoing effort to make Windows 11 feel more consistent.
More generally, this feels like a positive sign for one of Windows 11’s biggest remaining design challenges. The operating system has already made real progress in areas such as Settings, File Explorer, the taskbar, and other Fluent Design experiences, and Microsoft now appears to be working further down the stack to modernise the older dialogs, Control Panel pages and administrative tools that still feel out of place. That is encouraging, because it suggests the company is not simply leaving those inconsistencies behind. The move towards WinUI 3, refreshed dialogs, and more modern inbox experiences points to a Windows 11 that could gradually feel much more joined up, polished, and cohesive over time.
Personally, I think this is a great idea. Windows is at its best when it feels consistent, predictable, and cohesive, rather than like a collection of tools from different eras. Modernising smaller areas such as Print Management may not grab headlines in the same way as bigger consumer features, but these changes can make the operating system feel more polished and easier to trust. If Microsoft can bring more of these older interfaces into the same design language without removing the power and flexibility people depend on, it could make Windows 11 feel much more complete.
Would you welcome a modern Print Management app in Windows 11, or would you rather Microsoft leave classic administrative tools alone? Let us know which older Windows dialog or utility you think should be next for a redesign.
"Scientists say they have detected promising signs that a planet orbiting a star 49 light-years from Earth could have an atmosphere," reports CNN, "making it potentially suitable for life."
Called LHS 1140b, the object is about five times the mass of our planet, or a "super-Earth." This planet orbits around its star in the "Goldilocks zone," also known as the habitable zone, meaning its surface temperature is not too hot or too cold for liquid water to exist... "It appears to be consistent with Earth, meaning it might have an iron core and a silicate mantle, plus some sort of low-density component, which is probably a combination of water and, now we know, an atmosphere," [said Collin Cherubim, a planetary scientist and lead author of a paper on the finding, published July 16 in the journal Science]... If further observations confirm the findings, LHS 1140b would mark the first discovery of an atmosphere on a rocky planet in the habitable zone of another star...
There is no evidence of life or a life-supporting atmosphere on LHS 1140b now, but Cherubim said he believes it's a formidable candidate for potential signatures of extraterrestrial life. "I think it's the best place to look for life outside the solar system at this point," he said. "It's mostly rocky, it's at the right temperature to support liquid water on the surface, and it has an atmosphere — those are the three key ingredients we look for..." Confirming the existence of an atmosphere on a rocky planet orbiting a red dwarf would be particularly exciting, Cherubim said, because the possibility of that happening is an open question in astronomy. "Can rocky planets have atmospheres around red dwarfs? This is the first bona fide yes," he said. "It's kind of a sigh of relief for a lot of us. But the jury's still out. Maybe this is a weird planet, and it's an oddball, or maybe it's the first of many. We don't know yet."
Now "The James Webb Space Telescope is going to look at it," Cherubim told CNN, and "Hubble's going to look at it. Basically, everybody who can see it is going to be training their eyes on it."
Michaël Gillon, research director of the Astrobiology Research Unit at Belgium's University of Liège warned CNN that no definitive proof exists that LHS 1140b possesses a substantial atmosphere. But if the detection of helium can be confirmed, the implications would be profound. "Until now, we had only limited evidence for atmospheres on temperate rocky exoplanets. Demonstrating that LHS 1140 b has retained a substantial atmosphere over billions of years would show that at least some habitable zone Super-Earths around red dwarfs can survive the intense early activity of their host stars."
The Hill published the thoughts of Gleb Tsipursky, Ph.D., who serves as the CEO of the future-of-work consultancy Disaster Avoidance Experts:
A recent EnhancV survey of 1,000 full-time U.S. workers subject to new or stricter return-to-office policies found that 72% suspect these mandates are really a voluntary attrition strategy — a strategy by their own employers to make them quit their jobs. A full 46% admit to the practice of coffee-badging. Thirty-six percent have applied for a new job while sitting at their current office desk. Thirty-six percent have started a side hustle since the mandate was announced, in anticipation of being let go or quitting. Those numbers do not prove that employees reject collaboration. They show that many employees no longer trust the official story...
The central mistake in many in-office mandates is the assumption that proximity automatically produces commitment. It does not. A worker who spends two hours commuting to sit on video calls with colleagues in other cities is not experiencing culture. That worker is experiencing theater. When executives describe the office as a cure-all, many employees experience lost time, higher costs and lower autonomy. The policy's defining feature becomes its credibility gap. Research keeps undercutting the belief that more office time automatically means better performance. A University of Pittsburgh analysis of S&P 500 firms found that return-to-office mandates reduced employee satisfaction without improving firm performance or firm value....
Baylor University's reporting on office mandates and brain drain found that firms with mandates faced greater turnover among women, senior employees, managers and high-skilled workers, while job vacancy duration increased and hiring rates declined. In other words, the people with the most options are often the first to leave. The employees who remain may not be the most committed — they may simply be the least mobile... Attendance can be mandated, but commitment cannot. When leaders confuse the two, they do not rebuild workplace culture. They create a room full of people planning their exit.
Get caught up on the latest technology and startup news from the past week. Here are the most popular stories on GeekWire for the week of July 26, 2026.
Amazon founder Jeff Bezos says the company’s custom AI chip business is poised to become its next “pillar,” joining Marketplace, Prime, and AWS as one of Amazon’s foundational businesses as the tech giant doubles down on artificial intelligence infrastructure. … Read More
After nearly three decades at Microsoft, cybersecurity executive Krishna Kumar Parthasarathy has announced he is joining Salesforce as executive vice president of engineering. … Read More
Los Angeles-based Nominal, whose software helps engineers build, test and validate complex hardware systems, is establishing a permanent Seattle office as it ramps up hiring and looks for a larger home in the region. … Read More
Known as “Automated Counting,” the tool was built in partnership with NomadGo to scan backroom storage shelves using iPad Pros equipped with computer vision, spatial computing, and augmented reality. … Read More
Bandai Namco is opening an official Gundam Base retail store at Westfield Southcenter mall in Tukwila, Wash., this fall, giving Pacific Northwest anime and model-kit fans a permanent flagship destination for all things Gunpla. … Read More
Renton, Wash.-based Wizards of the Coast previewed its D&D plans ahead of Gen Con, including a “World of Warcraft” crossover sourcebook due Nov. … Read More
The Washington Technology Industry Association’s new “Tech Universe Map” charts the founder lineage of 625 companies, showing that Microsoft and the University of Washington account for the largest share. … Read More
Guru Baran reports: Brinks Home, one of North America’s largest residential security providers, has confirmed that hackers breached its IT systems after the notorious ShinyHunters extortion group claimed responsibility for stealing nearly five million records tied to the company’s Salesforce environment. The confirmation comes after the threat actors listed “BH Security, LLC (brinkshome.com)” on their...