Discover why standard prompt injection is evolving into a greater threat with AI browsers. Learn about indirect injection risks and how to secure your LLM applications.
The browser wars of the 1990s and 2000s fought over speed, rendering standards, and market share. Today, a new and far more complex battle has begun: we are moving away from the traditional web, where users visit websites,toward the “agentic web,” where AI intermediates every interaction.
At Web Summit 2025, Mozilla CEO Laura Chambers and Cloudflare CEO Matthew Prince joined Mike Butcher from PreFounders to dissect this transition.
Their conversation revealed a stark reality – the way we consume information is fundamentally changing, and without new rules, the economic model of the internet could collapse. As Chambers put it, we must ensure “the web doesn’t become siloed or closed off” during this massive shift.
Welcome to the new web where AI browses and we chill
For decades, a browser acted as a simple container. You typed a URL, the browser fetched the content, and you read it. Chambers argues that this era is ending:
I think we’re moving from a world where browsers are simple containers. We are entering a phase of agentic activity where “the browser, or the AI agent inside it, takes action on our behalf.”
Prince views this as a massive platform shift, comparable to the transition from desktop to mobile. He predicts that in the near future, personal AI agents will handle the majority of information retrieval and commerce.
While this promises efficiency, it fundamentally breaks the relationship between creators and consumers. “AI is the next platform shift,” Prince stated. “In the future, the way people interact with information will be through their personal AI agent.”
Houston, we’ve got a “vampire bot” problem
The most immediate danger lies inhow AI browsers interact with publishers. Prince highlighted a growing trend where AI agents overstep boundaries. A user might ask an AI browser to read one article from The New York Times. The agent visits the site to fulfill the request but acts aggressively. Prince described the behavior:
They’ll read the specific article the user asked for but then they’ll also scrape everything published on that site that day.
This behavior undermines the business model of journalism. Publishers rely on human traffic, subscriptions, and ad impressions. If an AI scrapes the content and summarizes it for the user, the original creator receives zero value. Prince warns that if AI companies consume content without contributing to the ecosystem, they will destroy the very data sources they need to survive. “If AI scrapes everything behind the paywall and redistributes it,” Prince warned, “the entire system breaks.”
Users put privacy first, don’t they?
Users claim to value privacy, yet they almost always choose convenience. Chambers noted that while Mozilla builds privacy-by-design into Firefox, the average user prioritizes a frictionless experience over data protection:
Unfortunately, what we typically see is that users choose convenience. They choose simplicity over privacy even when they say they value privacy.
This creates a dangerous feedback loop. If the most convenient AI tools are also the most invasive, users will surrender their data without a second thought. Chambers believes the solution lies in “optionality.” Browsers must allow users to choose between a classic, private experience and an AI-enhanced one.
However, Prince suggests that users no longer care about original sources. Data from Cloudflare shows a sharp decline in click-through rates for users of AI tools like Anthropic and OpenAI. “Younger users especially aren’t opening 10 blue links,” Prince noted. “They want the answer, not the process.” The “ten blue links” of a Google search are becoming artifacts of the past.
The browser can act as a trusted middleman
If users demand AI, how do we protect privacy? Prince proposed a novel role for independent browsers like Firefox. He argues that the browser should act as a trusted intermediary between the user and the AI model:
I want to type something into a trusted intermediary, and have it figure things out.
In this scenario, the browser holds the user’s context and memory. When a user asks a question, the browser anonymizes the data, converts it into mathematical vectors, and sends it to the best available model (whether that is OpenAI, Gemini, or Anthropic). The AI provider receives the math needed to answer the query but never learns the user’s identity. “You can encode that as math,” Prince explained, noting that the data becomes “irreversible but meaningful enough for the model to do its job.”
This approach positions organizations like Mozilla and Apple as vital gatekeepers. They can verify that a request comes from a real human without revealing who that human is. This “proof of humanity” will become the most valuable currency on an internet flooded with bots.
The “click” is dying
The current trajectory of the web favors a monopoly where one or two AI giants control all information flow. Both CEOs agree that this is a dystopian outcome. A healthy internet requires diversity, where small businesses and independent publishers can still thrive. “A good future isn’t one with only five AI companies,” Prince declared. “It’s one with tens of thousands.”
Cloudflare intends to enforce rules that penalize bad actors who scrape content aggressively. Meanwhile, Mozilla continues to maintain its own engine, Gecko, to ensure that commercial interests do not solely dictate web standards. Chambers insisted:
We need the voice of the people represented in these conversations
The business model of the internet is about to change. The “click” is dying. The challenge for the next five years is to invent a new economic system that rewards creators in an age where AI answers every question. If we fail to do so, the open web may simply disappear inside a chatbot’s dialogue box. As Prince concluded, “We must find a way for publishers to continue earning revenue.”
Josh Miller (left) and Hursh Agrawal. Midjourney/Every illustration.
Tl;dr: It’s nearing the Thanksgiving holiday in the U.S., so we’re republishing one of our favorite episodes from our podcast AI & I. Dan Shipper went in-depth with Josh Miller and Hursh Agrawal, cofounders of The Browser Company, which created the popular web browser Arc and, more recently, Dia. It follows Rhea Purohit’s piece about which AI browsers the team is using; Dia made the grade for several of our engineers. Watch on X or YouTube, or listen on Spotify or Apple Podcasts. Here’s a link to the episode transcript.
This Black Friday: Get 25% off a paid Every subscription when you upgrade—full access to Every’s AI tools, expert courses, model reviews, and hundreds of essays. Offer ends December 1.
Upgrade for 25% off
Was this newsletter forwarded to you? Sign up to get it in your inbox.
Sometimes, building the future means grieving what you love—and following a hunch into the unknown.
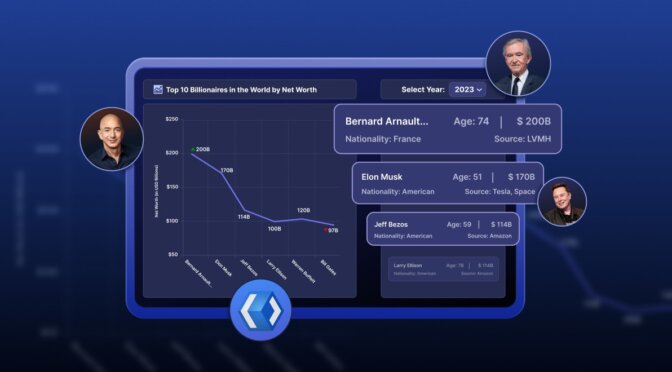
TL;DR: Learn how to build an AI-powered WinUI Line Chart to visualize billionaire wealth trends. This guide covers real-time data binding, anomaly detection, and interactive chart customization for financial dashboards.
Tracking and comparing billionaire wealth across different years isn’t just fascinating, it’s a powerful way to uncover global financial trends and understand how fortunes shift over time. In this tutorial, we’ll build an AI-powered WinUI application that uses Syncfusion WinUI Charts to visualize the net worth of the world’s top 10 billionaires with a sleek SfCartesianChart LineSeries.
What You’ll Build
In this project, we’ll combine AI-driven data generation with modern UI components to create an interactive dashboard that makes exploring trends in billionaire wealth effortless.
Generate a structured dataset of the top 10 richest individuals using Azure OpenAI.
Bind the data to a WinUI Line Chart for clear and dynamic visualization.
Highlight key insights, such as the highest and lowest net worth.
Apply structured axis styling and customized data labels for better readability.
Implement a year selector and display rich details, such as age, nationality, and industry.
Design a polished, responsive UI for an engaging user experience.
By the end of this tutorial, you’ll have a responsive, data-driven dashboard that dynamically updates as you explore billionaire wealth trends across different years.
Why this solution works
Here’s why this approach is effective and practical for building a modern, interactive financial dashboard:
Dynamic updates: Refresh the chart instantly based on the selected year.
Clear comparisons: A LineSeries with labeled points makes ranking and trend analysis easy.
Modern WinUI styling: Leverage WinUI theming with a card-based layout and data labels.
Extensible design: Add tooltips, legends, or anomaly highlighting as needed.
Uses and scenarios
This solution is versatile and can be applied in various real-world contexts, including:
Executive dashboards tracking billionaire wealth by year.
Educational demos for charting, data binding, and WinUI UI composition.
Finance analytics prototypes that need fast, well-structured charting and list views.
Why use AI for billionaire wealth tracking?
Traditional billionaire lists rely on periodic updates from public filings and news, which can be inconsistent and lag behind real events. By combining Azure OpenAI with modern charting dashboards, you get:
Faster aggregation: AI consolidates names, net worth, industries, and sources into a clean JSON schema.
Normalized, comparable records: Automatically standardize currencies, units, and name variants for accurate comparisons.
Data enrichment: Fill gaps with inferred details like age, nationality, and industry.
Change detection: Highlight year-over-year shifts and probable drivers such as market moves, IPOs, and acquisitions.
Trend insights: Generate natural-language highlights aligned with chart data.
Forecast-ready structure: Enable projections and scenario testing.
Rapid prototyping: Quickly create realistic datasets for development and demos.
Extensible integrations: Combine AI-curated lists with market APIs for real-time updates.
Let’s walk through the steps for building an AI-powered WinUI dashboard that visualizes billionaire wealth by year.
Step 1: Supply the dataset via the AI service
Start by using Azure OpenAI to generate a year-specific dataset of the top 10 billionaires. Deserialize the response into strongly typed objects for charting and UI binding.
Define the data model
Creating a simple, chart-friendly model with the necessary fields for plotting:
namespace WorldRichestPeople
{
    public class RichestPeopleModel
    {
        public string? Name { get; set; }
        public double NetWorth { get; set; }
        public double Age { get; set; }
        public string? Nationality { get; set; }
        public string? PrimarySource { get; set; }
    }
}
Implement the AI-backed data provider
This service crafts a strict prompt, calls Azure OpenAI, extracts the raw JSON array, and converts it into a list of RichestPeopleModel entries. Configure these settings:
Endpoint: HTTPS URL of your Azure OpenAI resource.
DeploymentName: Model deployment name, such as gpt-4o or gpt-35-turbo.
Key: Your secret API key for authentication; keep it private and rotate it if exposed.
Refer to the below code example:
public class RichestPeopleAIService
{
    internal const string Endpoint = "YOUR_END_POINT_NAME";
    internal const string DeploymentName = "DEPLOYMENT_NAME";
    internal const string Key = "API_KEY";
    internal bool IsValid { get; set; }
    internal IChatClient? Client { get; set; }

    public RichestPeopleAIService()
    {
        _ = ValidateCredential();
    }

    internal async Task ValidateCredential()
    {
        // Validate credentials and initialize the chat client
    }

    public async Task<List<RichestPeopleModel>> GetTopRichestByYear(int year)
    {
        // Get top 10 richest by year via AI (or fallback data if invalid)
    }

    private void GetAzureOpenAIClient()
    {
        // Create AzureOpenAI client with Endpoint/Key and bind to DeploymentName
    }

    private async Task<string> GetAnswerFromGPT(string prompt)
    {
        // Send prompt to Azure OpenAI and return raw response
    }

    private static string ExtractJsonArray(string response)
    {
        // Extract the first JSON array from the AI response
    }
}
Bind results to the ViewModel
Trigger the AI call for the selected year and expose the collection for chart and list binding.
public async Task RefreshForSelectedYearAsync()
{
    var list = await service.GetTopRichestByYear(SelectedYear) ?? new();
    Data = new ObservableCollection<RichestPeopleModel>(list);
    UpdateMinMaxValues();
}
Step 2: Add a dashboard header
Begin with a clear header to establish context. A simple StackPanel and TextBlock deliver a focused title and a consistent visual anchor for the page.
<StackPanel>
    <TextBlock Text="Top 10 Billionaires in the World by Net Worth"
               Foreground="{StaticResource HeaderTextBrush}"
               FontSize="22"
               FontWeight="SemiBold"/>
</StackPanel>
Step 3: Add a year selector
Introduce a compact SfComboBox bound to Years and SelectedYearString. When a new year is selected, the dashboard triggers a fresh AI fetch, updating the chart and list seamlessly:
Bind a LineSeries to the data, setting XBindingPath to the Name field and YBindingPath to the NetWorth field. Configure axes and data labels for clarity:
XAxis: CategoryAxis for names.
YAxis: NumericalAxis for net worth.
DataLabelSettings: Show ▲ for max and ▼ for min values.
Use a converter to trim long names for readability.
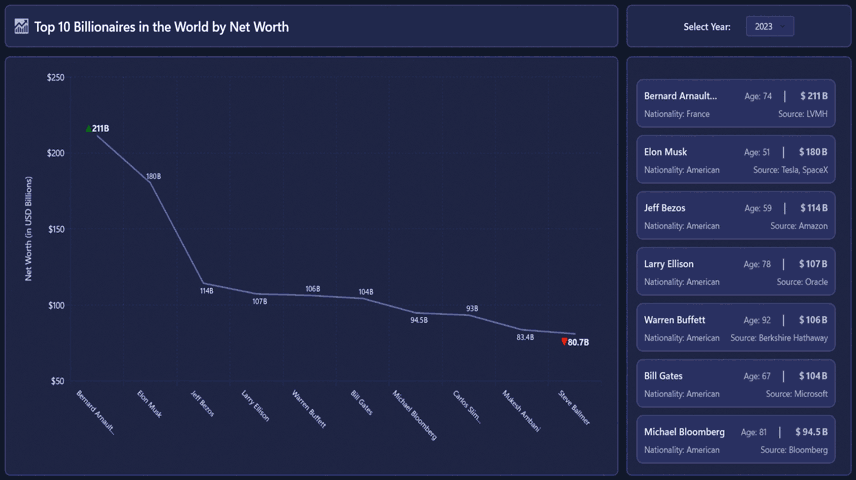
Visualizing top 10 billionaires’ net worth by year in a WinUI Line Chart
Step 5: Display a clean ListView with key attributes
To complement the chart, add a minimalist ListView that mirrors the dataset and highlights essential attributes. This list provides quick access to details that the chart alone cannot convey.
Start by trimming long names to the first two words and appending an ellipsis for readability. Display the age inline and format the net worth using a compact pattern such as $… B. Add a second row to show nationality and primary source for additional context.
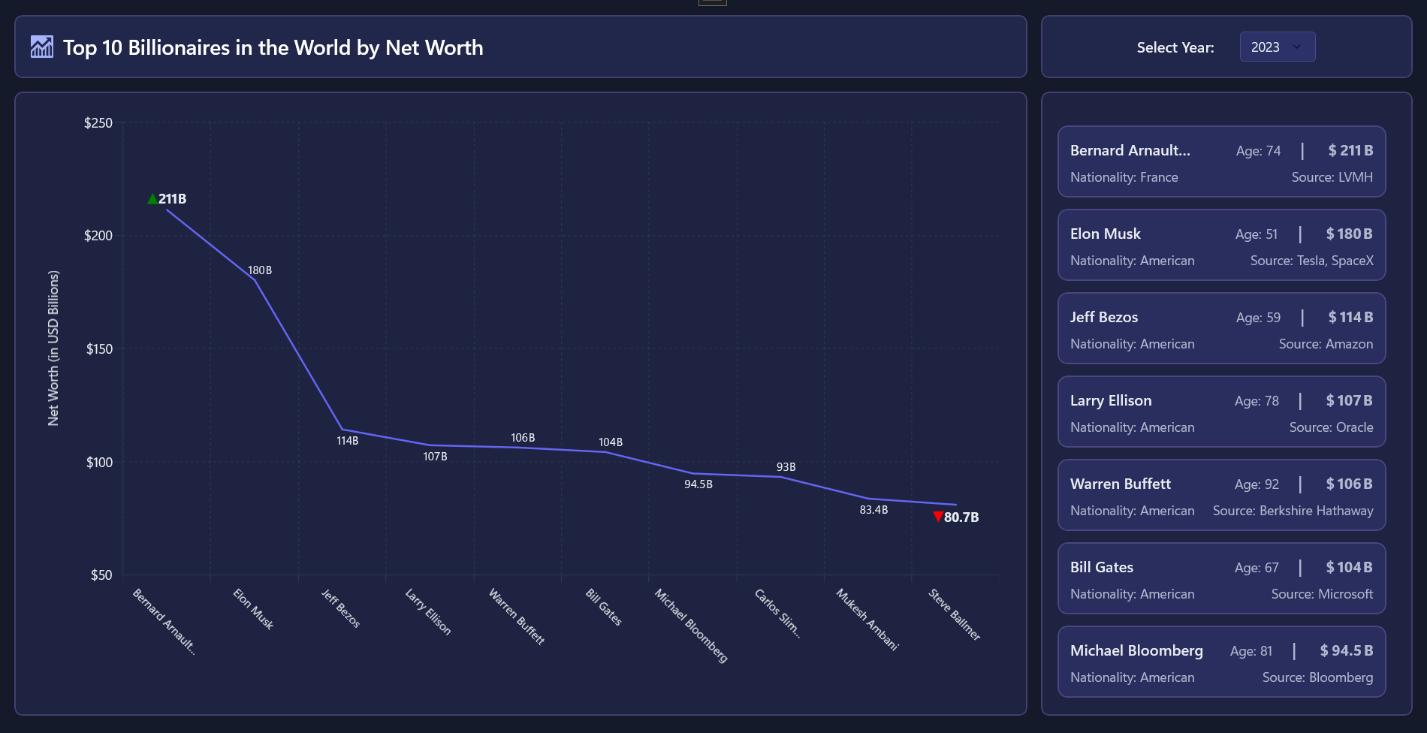
Visualizing billionaire details in a WinUI Line Chart
Converters for Enhanced Readability
Use converters to shorten long names and highlight extremes in the dataset. For example, trim names longer than two words and apply color coding for the highest and lowest values:
public class NameTrimConverter : IValueConverter
{
    public object Convert(object value, Type targetType, object parameter, string language)
    {
        // Convert: trims full names longer than two parts to "First Last…"
    }
    public object ConvertBack(object value, Type targetType, object parameter, string language)
            => throw new NotImplementedException();
}

public class DataLabelConverter : IValueConverter
{
    public object Convert(object value, Type targetType, object parameter, string language)
    {
        // Convert: sets label font/size/shape/fill based on item rank and requested parameter
    }
    public object ConvertBack(object value, Type targetType, object parameter, string language)
            => throw new NotImplementedException();
}
By running the sample, you’ll get the completed AI-powered billionaire wealth dashboard that includes:
A responsive details list that updates automatically when the year changes
This layout delivers a clean, modern experience for financial visualization.
GitHub reference
For more details about the AI-Powered WinUI Line Chart to visualize the wealth of billionaires, refer to the GitHub demo.
Conclusion
Thanks for reading! This blog explored how to build anAI-Powered WinUI Line Chart to visualize the Wealth of Billionairesusing the Syncfusion WinUI Line Chart. You learned how to generate structured data using Azure OpenAI, bind it to a WinUI chart and list, and apply polished UI styling for a modern dashboard experience. Try running the sample, experiment with additional features like tooltips or anomaly detection, and share your thoughts in the comments!
If you’re a Syncfusion user, you can download the setup from the license and downloads page. Otherwise, you can download a free 30-day trial.
TL;DR: Angular 21 introduces zoneless change detection, signal-based forms, and faster builds with esbuild/Vite. Syncfusion ensures full compatibility with Angular UI components, allowing developers to upgrade immediately without any compatibility issues. This guide covers the key features and migration steps.
Angular 21 is officially here, bringing significant improvements in performance, reactivity, and developer experience. With features like zoneless change detection, signal-based forms, and faster builds powered by esbuild and Vite, this release enables the faster and easier development of large-scale applications.
Syncfusion is proud to announce full compatibility with Angular 21.0.0.
No patches, no workarounds, no waiting for updates, simply run: ng update @angular/core @angular/cli and keep building enterprise applications with confidence.
In this post, we’ll highlight the standout features of Angular 21, why they matter for your next project, and how Syncfusion’s Angular components deliver seamless support.
Historically, Zone.js patched browser APIs to trigger change detection automatically, but it added overhead to bundles and complexity to the change detection model. Angular 21 enables zoneless mode by default, eliminating the need for Zone.js in most applications. The result: smaller bundles, faster dev/rebuild times, and improved runtime performance.
2. Experimental signal-based forms
Signal-based forms introduce an experimental API that models form using Angular signals instead of observable subscriptions. While reactive forms rely on FormGroup/FormControl and subscription management, signal-based forms expose value, validity, errors, and disabled state as reactive signals that update automatically without manual subscriptions. This reduces boilerplate, lowers the risk of memory leaks, and enables finer-grained change detection, keeping forms synchronized through Angular’s reactivity system.
3. Angular MCP server for AI-assisted development
Angular’s Model Context Protocol (MCP) server has become stable now. It surfaces project structure, APIs, best practices, and conventions to AI coding tools like GitHub Copilot and Cursor. This context-aware bridge enables more accurate code suggestions, smarter scaffolding, and edits that align with your routing, components, and build setup. The feature is emerging and continues to evolve across supported tooling.
4. New @angular/aria package
The @angular/aria package introduces framework-level utilities that simplify building accessible applications. It centralizes common ARIA patterns and reduces the boilerplate needed to support assistive technologies across components and templates.
5. Esbuild/Vite application builder
Angular 21 introduces a major improvement in its build system by adopting esbuild and Vite as the default application builder. This change impacts both development and production workflows.
6. Vitest as the default test runner
Angular 21 introduces Vitest as the default CLI test runner, replacing the traditional Jasmine/Karma setup. This marks a major modernization of Angular’s testing ecosystem. Vitest is a fast, Vite-powered test runner built for modern JavaScript frameworks. It is ESM-native, ensuring seamless compatibility with ES modules. Since it is built on top of Vite, Vitest inherits the same speed, efficient module handling, and improved developer experience that Vite offers.
7. HttpClient and smarter template/styling ergonomics
Angular 21 simplifies HTTP communication by makingHttpClientavailable by default in new applications. Developers no longer need to manually import HttpClientModule; you can directly inject HttpClient into your services or components and start making API calls immediately. This small but impactful change reduces boilerplate and speeds up development for apps that rely on HTTP requests.
Template and styling ergonomics also see notable improvements. The NgStyledirective now works seamlessly with Angular’s new control flow syntax (@if, @for), making conditional styling more intuitive.
Additionally, NgClass is moving toward native class bindings for better readability and performance, though existing usage will continue to work. These updates make Angular templates cleaner, more expressive, and aligned with modern best practices.
Angular 21 delivers performance, improved reactivity, and developer experience enhancements that make large-scale applications faster and easier to maintain. Syncfusion ensures seamless compatibility so you can upgrade without friction.
Key benefits include:
Zero-day compatibility
Syncfusion offers immediate support for Angular 21 without requiring patches or updates.
Developers can upgrade Angular and continue using Syncfusion components seamlessly.
Performance gains
Bundle size reduction: 12–22% smaller bundles when using zoneless mode.
Faster initial render: 15–28% improvement in rendering speed for major components like Grid, Charts, and Document Editor.
Zoneless change detection support
All Syncfusion components in Essential Studio version 31.x are zoneless-compatible, ensuring smooth migration and better performance.
In applications featuring major components such as Grid, Charts, Document Editor, and Scheduler, we observed an initial render time around 18.97% faster
With Syncfusion components, the sample application rendered in Angular 21 took an average of 1.10 seconds, compared to 1.36 seconds in Angular 20.
AI-assisted development via the MCP server
The Angular MCP server works with tools like GitHub Copilot to generate context-aware code.
Syncfusion provides its own MCP server, enabling AI tools to produce production-ready code using Syncfusion APIs.
Faster builds with Esbuild/Vite
Angular 21 uses esbuild + Vite by default for faster builds.
Syncfusion components benefit from reduced build times and optimized bundle sizes without extra
No Syncfusion package update required
Existing Syncfusion versions (31.x or later) work perfectly with Angular 21.
Migration steps are minimal, just update Angular CLI and core packages.
Upgrading your Syncfusion-powered app to Angular 21
Follow these steps to migrate Angular applications that use Syncfusion components to Angular 21.
Step 1: Update Angular CLI globally
Run the following command to install the latest Angular CLI:
npm install -g @angular/cli@21
Step 2: Update the project
Upgrade the core Angular packages and CLI within your project:
ng update @angular/core@21 @angular/cli@21
Step 3: (Optional) Switch the existing app to the new builder
If you want to take advantage of Angular’s new build system, generate the new builder configuration:
ng generate @angular/application-builder
Step 4: Run tests, deploy, and enjoy the speed boost.
After updating, run your tests to ensure everything works as expected. Once verified, deploy your application and experience the improved performance and build efficiency in Angular 21.
Discover the power of Angular 21 combined with Syncfusion’s rich component library. Start by exploring the Syncfusion Angular components in our Feature Tour and download or update the latest Syncfusion Angular packages to take advantage of new capabilities.
Syncfusion also provides an MCP server for Angular components to guide you through integration and best practices. For detailed instructions, refer to the official documentation.
Angular 21 is here, and with Syncfusion’s full compatibility, there’s no reason to wait. Upgrade today to deliver faster, lighter, and more accessible applications.
Which Angular 21 feature are you most excited to try with Syncfusion components? Share your thoughts in the comments below. If you have any questions or need assistance, reach out through our support forum, support portal, or feedback portal . Our team is always ready to help.