Errors happen. Sometimes they are simple, and sometimes they are very specific to your domain. C# gives us many built in exceptions, but they do not always tell the full story. That is where custom exceptions come in.
In this post, we are going to look at how to create your own custom exceptions in C#. We will keep it simple, practical, and easy to use in real projects.
Why custom exceptions exist
Imagine you are building an ordering system. A user tries to place an order, but the business rules say no. You could throw something like this:
thrownewInvalidOperationException("User cannot place this order");
This works, but it does not say much. Later on, when you read logs or handle errors, you have to rely on the message string.
Now compare it to this:
thrownewOrderNotAllowedException(userId);
This tells a clear story. Something specific went wrong, and it belongs to your domain.
Creating a basic custom exception
A custom exception is just a class that inherits from Exception.
The real power of custom exceptions comes from adding context. Instead of putting everything into the message, you can add properties.
publicclassOrderNotAllowedException:Exception{publicGuidUserId{get;}publicOrderNotAllowedException(GuiduserId):base($"User {userId} is not allowed to place an order"){UserId=userId;}}
Now your logs and error handlers can access UserId directly. No string parsing needed.
Do you need serialization constructors
In older .NET versions (.NET Framework 4.x and earlier), you often saw extra constructors for serialization. If you are using a modern version of .NET, a simple exception class like the ones above is enough.
When not to create custom exceptions
Custom exceptions are useful, but they are easy to overuse.
Try to avoid these situations:
Using exceptions for normal control flow
Creating very generic custom exceptions that add no value
Exposing internal exception details from public APIs
If a built in exception already describes the problem well, use it.
A quick checklist
Before creating a custom exception, ask yourself:
Does this represent a real exceptional case
Does it add meaning beyond a message string
Does the name clearly describe the problem
If the answer is yes, a custom exception is a good fit.
That is a wrap
Custom exceptions are a small feature, but they can make your code much clearer and easier to maintain. Used well, they tell a story about what went wrong and why.
I hope this post gave you a quick introduction to creating your own exceptions in C#. If you have thoughts or questions, feel free to leave a comment or find me on my socials.
A long‑awaited milestone is finally real: generics are supported in .NET nanoFramework, and the public preview starts today! 🥳 This post is intentionally more than an announcement. It’s a behind-the-scenes tour of what it actually took to get here: the metadata and tooling work, the runtime and type system changes, and the many “small” edge … Continue reading Hello, <T>here: generics are here for nanoFramework→
AI is writing more of our code than ever before—but should we actually trust it? In this episode of JavaScript Jabber, I sat down with Itamar Friedman from Codo (formerly Quoto) to dig into one of the biggest questions developers are wrestling with right now: What happens when AI is generating code, reviewing code, and shaping how we ship software?
We explore where AI fits into modern code review, whether developers should be worried about job security, and how human responsibility still plays a critical role—even in an AI-powered workflow. From guardrails and quality standards to the future of agent-driven development, this conversation goes beyond hype and gets into what’s actually working today (and what still needs a human in the loop).
AI isn’t replacing developers—it’s changing how we build, review, and take ownership of software. If you enjoyed this conversation, make sure to rate, follow, share, and review JavaScript Jabber. It really helps the show, and it helps more developers join the conversation. Thanks for listening—and we’ll see you next time!
For this special holiday episode, we’re celebrating the Internet Archive’s milestone of 1 trillion web pages archived with something a little different: live music created just for the occasion.
Join us for conversations with composer Erika Oba, composer Sam Reider, and cellist Kathryn Bates of the Del Sol Quartet, recorded around The Vast Blue We, the concert held at the Internet Archive to honor our shared digital memory. Two new commissions premiered that night: Oba’s “Blue Lights” and Reider’s “Quartet for a Trillion,” both written to capture the wonder and scale of the open web—and brought to life by Del Sol Quartet. Oba later reconfigured “Blue Lights” for a solo performance during The Web We’ve Built celebration.
In this episode, you’ll hear brief conversations with the artists about their creative process, followed by recordings from the performance itself. A short, reflective holiday release that celebrates collaboration, imagination, and what we can build together.
Microsoft told Windows Latest that the company does not plan to rewrite Windows 11 using AI in Rust, which is a programming language that is more secure than C and C++. But the clarification is not coming out of nowhere, as a top-level Microsoft engineer made bold claims of using AI to replace C and C++ with Rust.
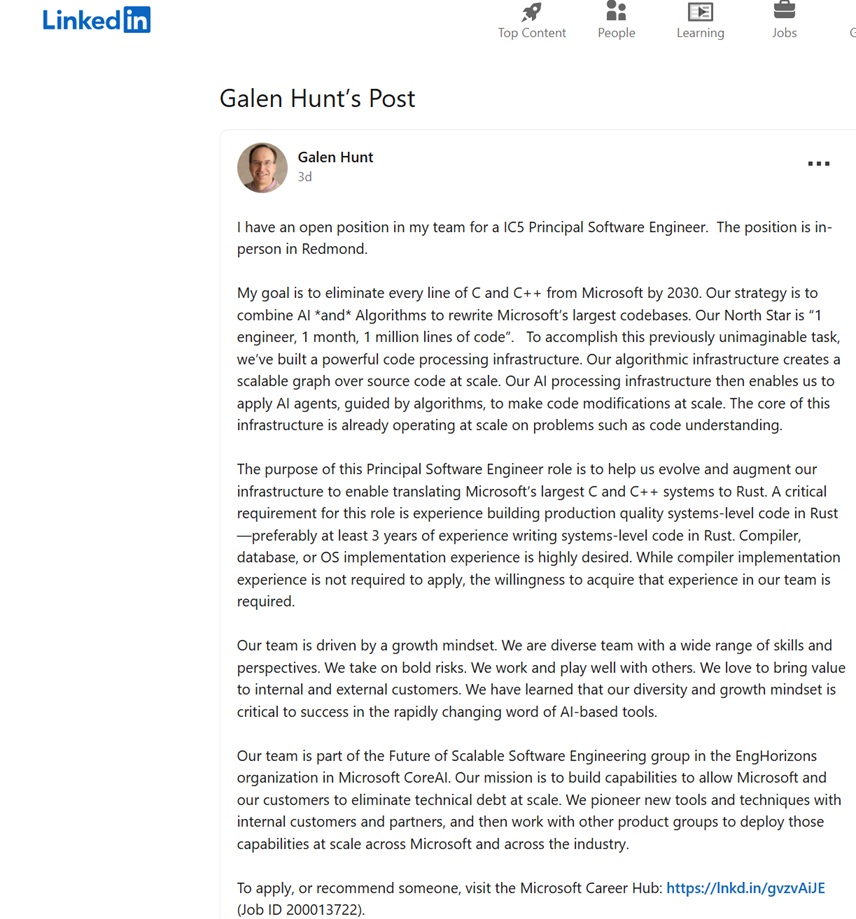
“My goal is to eliminate every line of C and C++ from Microsoft by 2030. Our strategy is to combine AI *and* Algorithms to rewrite Microsoft’s largest codebases. Our North Star is “1 engineer, 1 month, 1 million lines of code,” Galen Hunt, who is a top-level engineer at Microsoft, wrote in a now-edited LinkedIn post.
“Eliminate every line of C and C++ from Microsoft by 2030” obviously suggests that Microsoft’s top-level engineer, who is responsible for several large-scale research projects, is talking about products like Windows. For those unaware, most of the Windows API level code, and even its kernel, is built in C, while C++ powers some of the apps.
I also screenshotted the LinkedIn post before it was edited out by the top-level Microsoft engineer:
Honestly, most people would not have taken this seriously if it did not come from a top-level Microsoft engineer. When someone with that kind of title and long history at the company talks about eliminating C and C++ and using AI to rewrite large codebases, it sounds less like a random idea and more like something Microsoft is at least exploring.
Moreover, the LinkedIn post repeatedly used “our”, which sort of makes it obvious he’s speaking on behalf of the company.
Following the outrage over plans to “eliminate every line of C and C++ from Microsoft by 2030,” Microsoft told Windows Latest that there are no such plans. Frank X. Shaw, who is a top-level executive and heads communications for Microsoft, also confirmed to Windows Latest that the company has no plans to rewrite Windows 11 using AI.
Galen Hunt, who originally claimed C and C++ are being replaced with Rust using AI, also updated his LinkedIn post with the following clarification:
“It appears my post generated far more attention than I intended… with a lot of speculative reading between the lines.. Just to clarify… Windows is *NOT* being rewritten in Rust with AI.
My team’s project is a research project. We are building tech to make migration from language to language possible. The intent of my post was to find like-minded engineers to join us on the next stage of this multi-year endeavor—not to set a new strategy for Windows 11+ or to imply that Rust is an endpoint.”
While Galen Hunt says people were “reading between the lines,” the reaction did not come out of nowhere. His post used very direct language about eliminating C and C++ by 2030 and using AI plus algorithms to rewrite large codebases, along with a “1 engineer, 1 month, 1 million lines of code” line.
In fact, the top-level engineer’s edited post still says his team would have “1 engineer, 1 month, 1 million lines of code.”
The original wording is what made it sound broader than a small research effort.
To truly understand an LLM's real production potential, you have to measure the performance of its serving engine. The high-performance inference technology at the core of Red Hat AI is based on the vLLM open-source project, whose performance optimization techniques are key to achieving speed and throughput at scale.
This article offers Kubernetes users a comprehensive, step-by-step approach to manually deploy and test the inference capabilities of vLLM. We will deploy the community version of a containerized vLLM server on OpenShift (as our Kubernetes distribution of choice) using NVIDIA GPUs and use GuideLLM, a specialized performance benchmarking tool, to generate the metrics needed to validate its capabilities under load.
GuideLLM is designed to run performance benchmarks against LLM inference servers. It is able to simulate multiple simultaneous users by sending requests concurrently at various rates. This allows us to understand how the vLLM server behaves under load, measuring critical metrics like request throughput, latency, and tokens per second to evaluate its suitability for production workloads. Please refer to this article or video to learn more about GuideLLM.
Prerequisites
Before you begin, ensure you have the following:
An OpenShift or Kubernetes cluster (this guide uses openshift version 4.17.15).
A node with NVIDIA GPUs (this guide uses NVIDIA A100s).
The NVIDIA GPU Operator installed on your cluster. This operator acts as a bridge between the GPUs on your nodes and the OpenShift scheduler. It manages drivers and exposes the GPU resource that pods need to request GPU access.
The oc command-line tool configured to access your cluster.
Note for Kubernetes Users: This guide uses OpenShift commands (oc), but can be easily adapted for Kubernetes by replacing oc with kubectl. OpenShift-specific features like Routes will have Kubernetes alternatives noted throughout the guide.
Step 1: Deploy vLLM on OpenShift/Kubernetes
Note on Inference Server Options:
This guide demonstrates vLLM deployment for simplicity and broad applicability across Kubernetes environments. However, for enterprise production deployments, Red Hat recommends using Red Hat AI Inference Server, which offers an enterprise-grade and supported version of vLLM. Alternatively, users can leverage Red Hat OpenShift AI, which expands Red Hat AI Inference Server's capabilities into a full, end-to-end gen AI/MLOps platform for the hybrid cloud.
Note: Replace <your-storage-class> with a storage class available on your cluster. You can find available classes by running oc get sc(or kubectl get sc for Kubernetes). If it returns empty you will first need to create a storage class.
Since we're using ReadWriteOnce (RWO) access mode with a single replica, local storage classes work well for this use case. If you plan to scale to multiple replicas, you'll need to change the accessMode to ReadWriteMany (RWX) and use an RWX-compatible storage class. Common storage class examples:
For Local/Block Storage (RWO):
LVMS (Logical Volume Manager Storage): lvms-vg1
OpenShift Data Foundation: ocs-storagecluster-ceph-rbd
Many models, like Llama 3.1, require authentication with a Hugging Face token. Create a secret to store your token. You will create a token using your Hugging Face account.
Now, create the Deployment manifest. This will pull the latest vLLM container image, mount the PVC and the secret, and start the server. This manifest defines everything our vLLM pod needs to run successfully.
6. Create a route for external access (optional for testing)
This step creates an external route so you can test the vLLM deployment from outside the cluster using curl or other tools.
oc expose service vllm-service --name=vllm-route
Kubernetes alternative:
# For vanilla Kubernetes, Routes are not available. Instead, use one of these options:
a) LoadBalancer Service (if your cluster supports it):
    kubectl patch service vllm-service -p '{"spec":{"type":"LoadBalancer"}}'
 b) NodePort (for testing):
    kubectl patch service vllm-service -p '{"spec":{"type":"NodePort"}}'
 c) Ingress Resource (requires an Ingress Controller installed)
Important note on benchmarking:
While we're creating a route for external testing, our GuideLLM benchmark job will use the internal service endpoint (http://vllm-service.vllm-inference.svc.cluster.local:8000) instead. This ensures accurate performance metrics by avoiding external network latency and ingress overhead that could skew the results. Benchmarking from inside the cluster provides true application-to-service performance measurements.
7. Test your deployed model by using curl
To verify that your model is deployed and accessible, you can try sending a curl request from your terminal using curl.
With our vLLM instance running, follow these steps to launch a guidellm job.
1. Create a PVC for storing benchmark results.
Just like the vLLM pod, the job's pod is ephemeral and will be deleted after it completes. We need a separate PVC to persistently store the output JSON report from the benchmark.
This manifest defines the benchmark job. Before we look at the complete manifest, let's understand the key GuideLLM benchmark flags we'll be using:
Understanding the benchmark configuration:
--target: The endpoint URL of the inference server to benchmark. We use the internal Kubernetes service DNS name for cluster-internal communication.
--model: The model ID to benchmark. Must match the model deployed in your vLLM server.
--processor: The tokenizer used to calculate token counts for statistics and synthetic data generation. Typically the same as the model ID.
--data: Defines the benchmark request shape. We use a JSON config specifying synthetic data with 1000 prompt tokens and 1000 output tokens per request.
--rate-type: The benchmark mode. "concurrent" maintains a fixed number of simultaneous requests. Other options include "poisson" (requests per second), "synchronous" (one at a time), and "sweep" (automatic load testing).
--rate: For concurrent mode, this specifies the number of concurrent users to test. In the example below, "1,2,4" means we'll run three separate benchmarks with 1, 2, and 4 simultaneous requests.
--max-seconds: Maximum duration for each benchmark iteration (300 seconds = 5 minutes per rate level).
--output-dir: The directory to save the JSON result files inside the container.
--outputs: The output files to create(json, csv, html)
You can monitor the status of the job by running oc get pods -w. Wait for the guidellm-benchmark-job pod to change its status from Running to Completed. Once complete you can view the benchmark output by doing an oc logs <guidellm-pod-name>. Delete the job oc delete job guidellm-benchmark-job.
Step 3: Retrieve the benchmark results
Once the job is complete, the results will be saved in the guidellm-results-pvc. To get the file, we can create a temporary "helper" pod that mounts the same PVC, and then use oc cp to copy the file to our local machine.
You will now have a benchmark-results.html and a benchmark-results.json file on your local machine with the detailed performance metrics from your vLLM server.
3. View the guidellm results UI on a web browser.
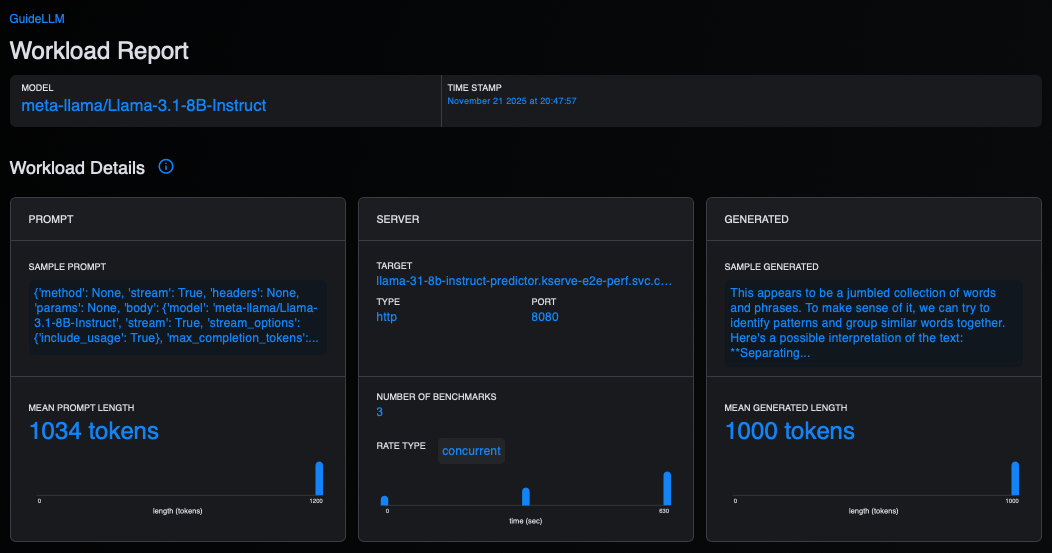
Open the downloaded HTML file with a web browser to view the Guidellm UI, which provides an interactive HTML report with tables and visualizations of benchmark results (Figure 1).
Figure 1: This figure shows the workload details within the GuideLLM UI.
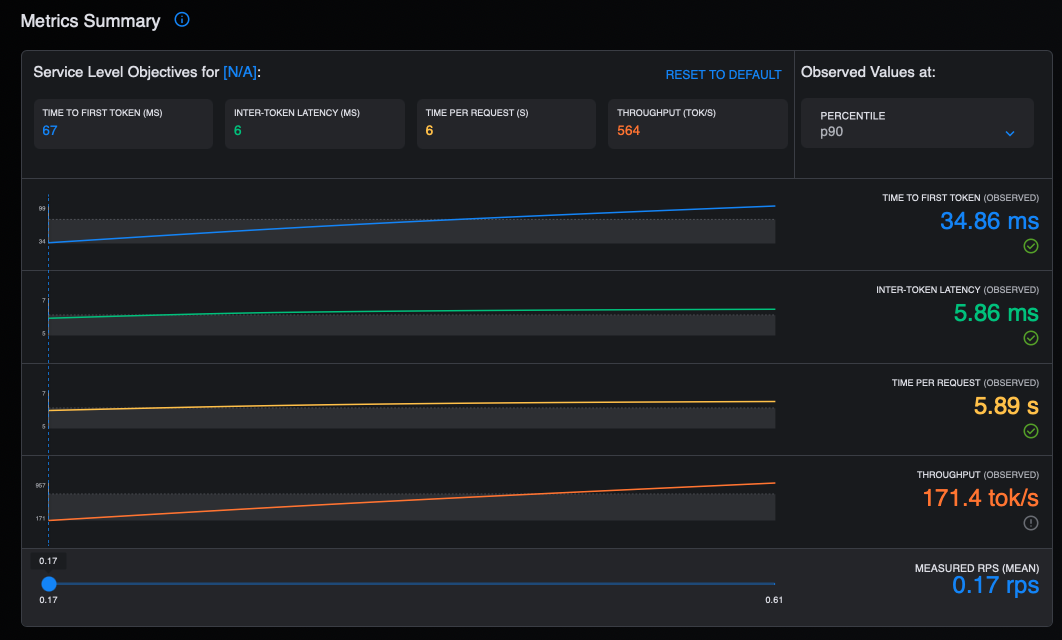
Figure 2 displays a summary of the metrics in the GuideLLM UI.
Figure 2: This graph provides a summary of the metrics in the GuideLLM UI.
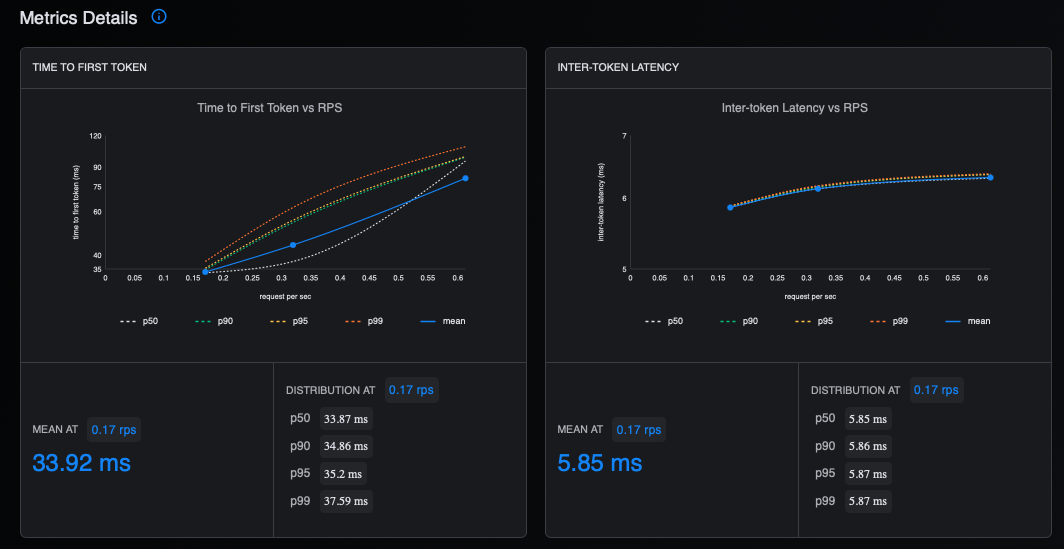
Figure 3 shows the latency in the GuideLLM UI.
Figure 3: This shows the latency in the GuideLLM UI.
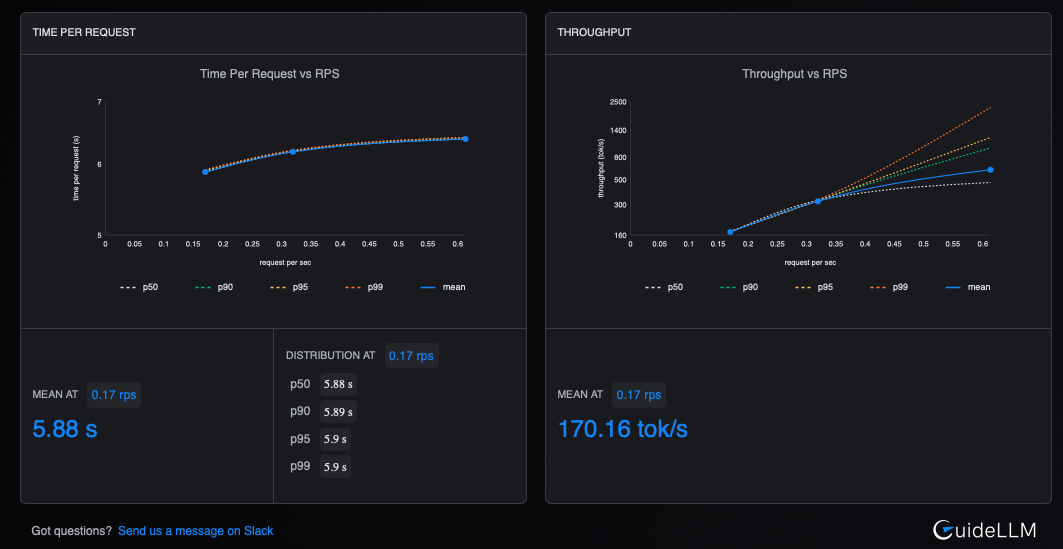
Figure 4 shows the time and throughput metrics.
Figure 4: This figure displays the time and throughput metrics in the GuideLLM UI.
4.Redisplay the benchmark results.
Guidellm also provides a convenient way to redisplay the results from the saved JSON file using the from-file command. You will need to install guidellm on your local machine using pip as follows:
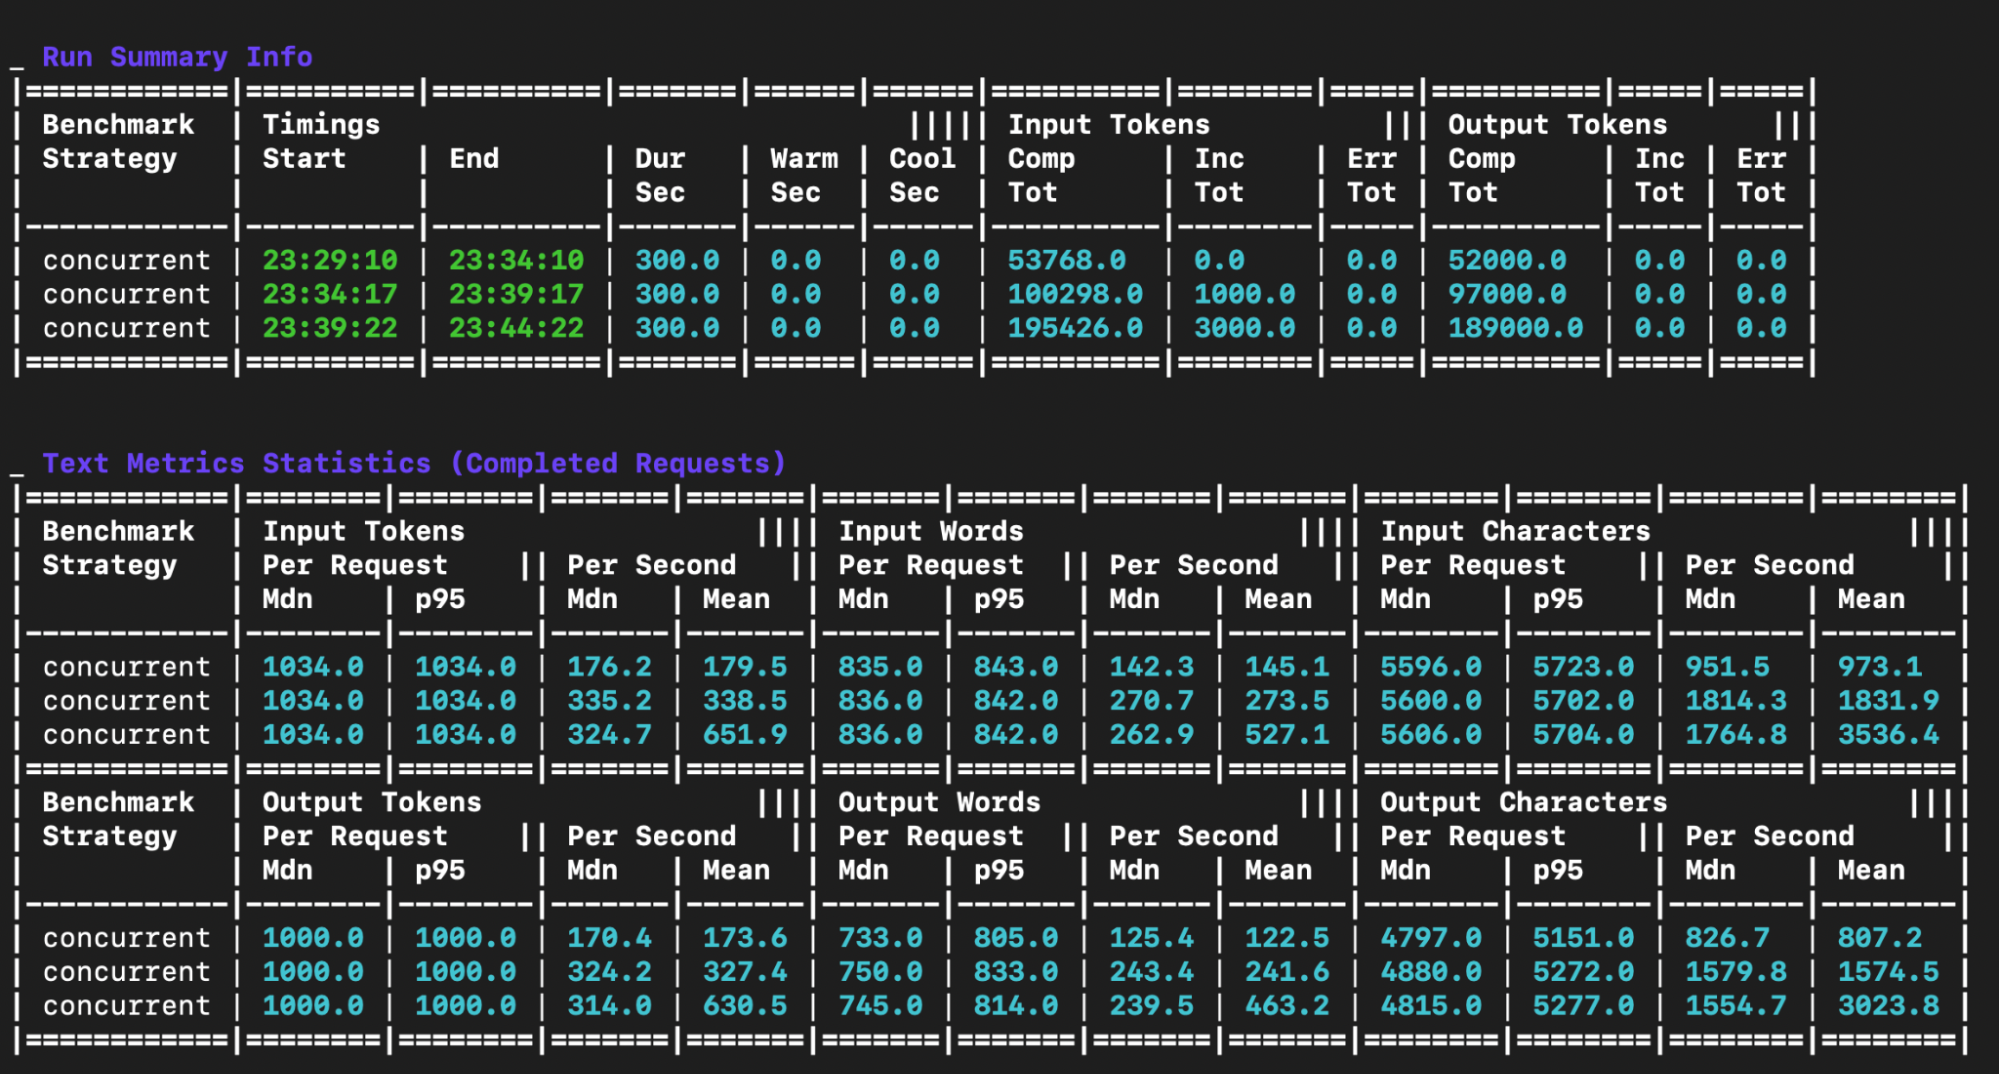
This command will parse the JSON output and display the result tables as shown in Figure 5.
Figure 5: This displays the GuideLLM benchmark result output.
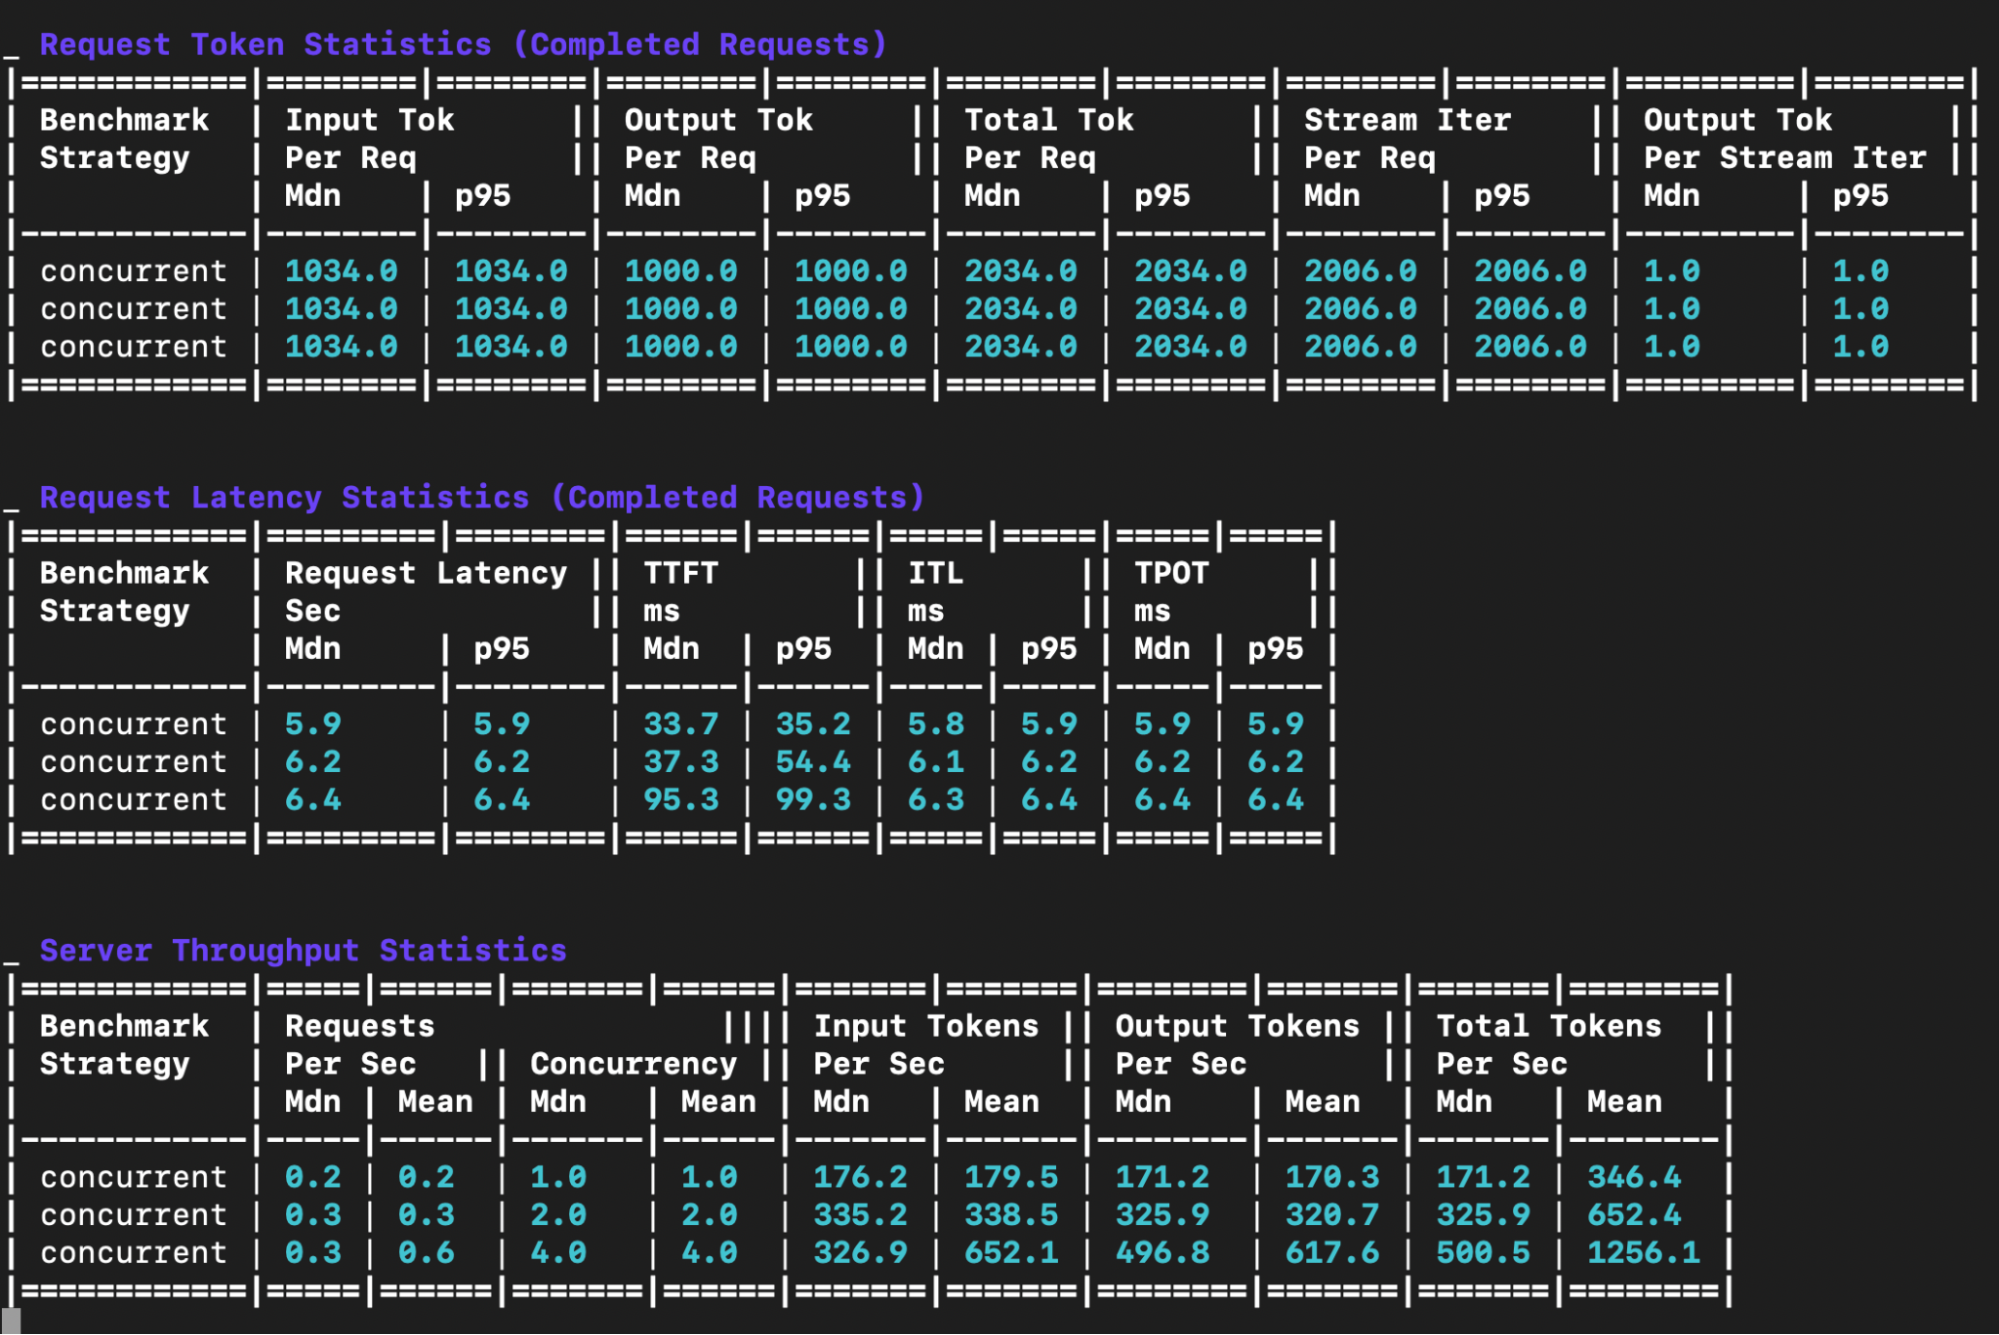
Figure 6 shows more output.
Figure 6: This shows the output for the GuideLLM benchmark result.
The output includes five main tables:
Run summary info table: This table shows metadata about each benchmark run.
Text metrics statistics table: This table offers a detailed breakdown of the text-related statistics for each benchmark run. It details the input and output token, word and character statistics on a per request and per second basis.
Request token statistics table: This table provides a statistical summary of the input, output and total token counts per request for each benchmark.
Request latency statistics table:
Request latency: Median and p95 end to end latency in seconds - the total time from request to completion
TTFT (Time to First Token): Median and p95 in milliseconds - measures how quickly the model starts generating a response after receiving a request. Lower is better and critical for interactive applications.
ITL (Inter-Token Latency): Median and p95 in milliseconds - the time between consecutive tokens during generation. Consistent low ITL provides smooth streaming experiences.
TPOT (Time Per Output Token): Median and p95 in milliseconds - the average time to generate each subsequent token. Lower values mean faster generation.
Server throughput statistics table: This table displays the throughput performance metrics for each concurrent load level.
Total Tok/sec: This is the total tokens (input + output) processed per second (a measure of overall system throughput).
Final thoughts
We have demonstrated the comprehensive benchmarking process detailing the production potential of Large Language Models on OpenShift. By combining vLLM and GuideLLM, organizations can measure critical, real-world metrics such as request throughput and latency, which are essential for achieving enterprise-grade readiness.
To continue your journey, dive deeper into GuideLLM and its capabilities by watching this technical overview. Explore an enterprise-grade, supported solution for your production workloads by reviewing the official documentation for Red Hat AI Inference Server.