Daniel Deogun and Dan Bergh Johnsson -- two of the co-authors of the book, Secure by Design -- discuss the intersection of good software design and security with host Sam Taggart. They describe how following certain software design principles can help developers create secure software without needing to become security experts. They talked about how this is the continuation of developers taking on more responsibilities: Agile asked developers to become responsible for testing their code. DevOps asked developers to work together with operations in deploying their code. Secure by Design asks developers to incorporate security into their designs.
Microsoft has released PowerToys 0.94 with the joyous news that the v0.94 release cycle is “focused on new features, stability, optimization improvements, and automation”. This is a big release – PowerToys 0.94 has a lot of new stuff in it, but there are two things that stand out. The first is a shortcut conflict detection feature which helps track down duplicated keyboard shortcuts. The second is fuzzy search within PowerToys Settings – which is important as the suite of tools is now a colossal collection. But, of course, there is more. Much more. Let’s take a look at the two… [Continue Reading]
This episode explains what is arguably the best career advice you'll hear this week: the one skill that signifies seniority in software engineers is the ability to synthesise and optimise for multiple factors at once. Instead of focusing on a single factor, such as performance or maintainability, senior engineers identify and weigh the various trade-offs involved in any decision.
Discover the key skill that distinguishes a senior engineer: It's the ability to synthesise multiple, competing factors—like performance, maintainability, cost, and time to market—rather than focusing on just one.
Learn why single-factor thinking can hold you back: Junior engineers often optimise for what they know best or what is easiest to measure, which can harm the overall solution, the team, and their professional reputation.
Understand how to demonstrate seniority in interviews and at work: You can show your maturity and wisdom by identifying the crucial trade-offs for any given problem, asking what factors need to be balanced, and exploring options that might satisfy multiple goals at once.
Explore how to find better solutions by thinking in trade-offs: The goal isn't just to make sacrifices; often, the mark of a great senior engineer is finding a third option that effectively balances or optimises for multiple important factors simultaneously.
Start practising this skill today: Challenge yourself to identify what you are giving up with any decision and consider factors you don't normally prioritise. Ask "What am I saying no to?" to develop this crucial skill.
📮 Ask a Question
If you enjoyed this episode and would like me to discuss a question that you have on the show, drop it over at: developertea.com.
If you want to be a part of a supportive community of engineers (non-engineers welcome!) working to improve their lives and careers, join us on the Developer Tea Discord community by visiting https://developertea.com/discord today!
🧡 Leave a Review
If you're enjoying the show and want to support the content head over to iTunes and leave a review! It helps other developers discover the show and keep us focused on what matters to you.
Join Elaiza Benitez and special guest, Sudeep Ghatak, Practice Lead at Theta New Zealand, to discover how Microsoft Copilot Studio enables intelligent agent-to-agent collaboration for seamless employee onboarding.
In this episode, Sudeep showcases multiple AI agents working together to automate key onboarding tasks such HR registration, IT setup, and facilities access. Learn how each agent is purpose-built to handle specific workflows, creating a scalable and efficient onboarding experience. Perfect for developers, IT professionals, and enterprise teams exploring advanced AI automation in Microsoft Copilot Studio.
Note: at the time of when this episode airs, this is a Preview feature.
✅ Chapters: 00:00 Introduction 01:13 Difference between bot and agent 02:02 Key features of agents 03:13 Agent use case - staff recruitment 05:20 Agent solution design 05:58 Recruitment agent 08:06 Offer Letter agent 09:14 Office Admin agent 09:34 Service Desk agent 09:56 Canvas app to initiate the hiring process 10:11 Demo of agent to agent collaboration 13:54 Outro 15:15 Limitations
How has DevOps changed in 2025? Carl and Richard talk to Michael Levan about his experiences helping teams automate their development workflows, and dealing with all the details that help the entire team focus on providing customer value. Michael digs into the role of the new AI tools in facilitating better workflows around code, testing, deployment, telemetry, and more. Then the conversation turns to security - and the many challenges that exist to make applications that are secure when deployed, and help with the security challenges that happen while in operation!
In today's complex IT environments, monitoring and understanding the health and performance of your applications and infrastructure is critical. The Red Hat build of OpenTelemetry, which can be installed in Red Hat OpenShift, provides a powerful framework for collecting and exporting telemetry data, enabling comprehensive metrics and logs reporting. In this article, we will explore the benefits and capabilities of using the Red Hat build of OpenTelemetry for effective observability.
OpenTelemetry is an open source project under the Cloud Native Computing Foundation (CNCF) that provides a set of APIs, libraries, agents, and collectors to capture distributed traces, metrics, and logs. Red Hat build of OpenTelemetry is a distribution of the upstream OpenTelemetry project, built and supported by Red Hat.
Collecting metrics with Red Hat build of OpenTelemetry
Metrics provide insights into the performance and health of your applications. The Red Hat build of OpenTelemetry can collect various types of metrics, including:
System metrics: CPU usage, memory consumption, disk I/O, etc.
Application metrics: Request latency, error rates, and throughput.
Custom metrics: Business-specific metrics tailored to your application needs.
You can export these metrics to various monitoring systems, such as Prometheus, for visualization and analysis.
Key benefits of Red Hat build of OpenTelemetry
The Red Hat build of OpenTelemetry simplifies the collection and management of telemetry data, offering several key advantages:
Standardization: Provides a unified way to collect and export data to third-party tools, reducing vendor lock-in.
Scalability: Designed to handle large volumes of data in complex environments.
Flexibility: Supports multiple data formats and backends, allowing integration with existing monitoring tools.
Red Hat support: Offers enterprise-grade support and maintenance from Red Hat, integration with Red Hat Observability UI and supported integration with third-party vendors.
Using Red Hat build of OpenTelemetry
You can seamlessly integrate Red Hat build of OpenTelemetry with existing monitoring and logging systems. The OpenTelemetry collector acts as a central hub for receiving, processing, and exporting telemetry data. OpenTelemetry Collector is composed of the following components.
Receivers:
Receives telemetry data from different sources.
Supported receivers include: OTLP, Jaeger, Host Metrics, Kubernetes Objects Receiver, and many others. Refer to the full list of supported receivers.
Select the Red Hat build of OpenTelemetry Operator that is provided by Red Hat and click in Install. Leave the default presets:
Update channel: stable
All namespaces on the cluster
Installed Namespace: openshift-operators
Update approval: Automatic
In the Details tab of the Installed Operator page, under ClusterServiceVersion details, verify that the installation Status is Succeeded.
Deploy OpenTelemetry collector
The OpenTelemetry collector is where all the magic happens. In the collector, you will define all the receivers, processors, and exporters you want in your environment. Let’s dig into the receivers that make more sense to use in a Kubernetes environment.
Host metrics receiver: Designed to collect performance metrics directly from the underlying host operating system. This includes vital information about CPU utilization, memory consumption, disk I/O, network traffic, and other system-level statistics. By monitoring these metrics, users gain insights into the health and resource utilization of the nodes running their Kubernetes cluster. This receiver is crucial for identifying potential bottlenecks or resource exhaustion at the host level.
Kubernetes objects receiver: Provides a way to observe the state of Kubernetes resources. It can monitor various Kubernetes objects such as pods, nodes, deployments, services, and more. The receiver captures metadata and status information about these objects, allowing users to track their health, configuration, and lifecycle events. This is essential for understanding the overall health and configuration of the Kubernetes cluster itself.
Kubelet stats receiver: Focuses on collecting detailed performance metrics directly from the Kubelet, the primary node agent in Kubernetes. These metrics offer granular insights into the resource usage and performance of individual pods and containers running on a specific node. Information such as CPU and memory usage per container, network statistics, and disk I/O at the pod level can be obtained through this receiver, enabling fine-grained monitoring and troubleshooting of application performance within the Kubernetes environment.
Kubernetes cluster receiver: The Kubernetes cluster receiver offers a broader view of the Kubernetes cluster's health and performance. It aggregates information from various Kubernetes components, providing insights into the control plane's operation, such as the API server's health, scheduler performance, and controller manager activity. This receiver helps in understanding the overall stability and responsiveness of the Kubernetes control plane.
Filelog receiver: For log collection, the filelog receiver is a versatile option. It allows the OpenTelemetry collector to tail log files present on the file system of the nodes. This is particularly useful for collecting application logs written to files, as well as logs from other services running on the Kubernetes nodes. The receiver supports various configuration options for specifying file paths, log formats, and multiline log processing.
Journald receiver: Specifically designed for systems utilizing systemd's journal for logging. It enables the OpenTelemetry collector to directly ingest logs from the systemd journal. This is beneficial in modern Linux distributions where systemd is the default init system, providing a centralized and structured way to collect system and application logs.
Kubernetes events receiver: Allows the OpenTelemetry collector to capture Kubernetes events. These events provide valuable insights into significant occurrences within the cluster, such as pod creation, deletion, scaling events, and resource issues. By collecting and analyzing Kubernetes events, users can gain a better understanding of the dynamics of their cluster and troubleshoot issues proactively.
Strategically select the receivers that make sense to your use case. You might not need all of them, but enabling the receivers mentioned previously will provide a very comprehensive metrics and logs reporting system tailored to Kubernetes environments. By selecting only specific receivers, you will keep the footprint of opentelemetry-collector low, allowing you to deploy the collector even in environments with limited resources.
Pipelines
A pipeline defines the complete lifecycle of telemetry data. This journey begins with the reception of data from various sources, continues through optional processing stages where the data can be transformed, enriched, or filtered, and culminates in the export of the data to one or more back-end destinations for storage, visualization, or analysis.
Metrics: These pipelines are designed to handle numerical measurements captured at specific points in time. Metrics are essential for monitoring the performance and resource utilization of systems and applications. They often include aggregated data and can be used to create dashboards and set up alerts.
Logs: These pipelines deal with textual records of events that occur within a system or application. Logs provide detailed information about the behavior and state of software and infrastructure. Effective log management involves collecting, processing, and storing logs in a structured and searchable manner.
Traces: These pipelines are concerned with tracking the execution of requests as they propagate through distributed systems. A trace represents the end-to-end journey of a request, consisting of individual spans that represent specific operations or calls. Tracing is crucial for understanding the flow of execution, identifying performance bottlenecks, and diagnosing issues in microservice architectures.
Each of these pipeline types has its own set of specialized receivers, processors, and exporters that are tailored to the specific characteristics of the telemetry data they handle. By configuring pipelines appropriately for metrics, logs, and traces, users can gain comprehensive observability into their applications and infrastructure using the Red Hat build of OpenTelemetry.
Now that we know how a collector works, let’s define a collector that will have all the receivers previously mentioned.
Receivers
The full collector is available here. The most important pieces are the following.
Host metrics receiver
Available scrapers for host metrics:
cpu: This scraper collects CPU utilization metrics, including information about user, system, idle, and wait times. Analyzing CPU metrics helps identify periods of high CPU load, which can indicate performance issues or the need for resource scaling.
memory: The memory scraper gathers information about memory usage, such as total, used, free, cached, and buffered memory. Monitoring memory metrics is critical for detecting memory leaks, insufficient memory allocation, or excessive memory consumption by applications.
disk: This scraper collects disk I/O metrics, providing insights into read and write operations, throughput, and latency for the host's disks. Analyzing disk metrics can help identify slow disks or I/O bottlenecks that might be affecting application performance.
load: The load scraper collects system load averages (1-minute, 5-minute, and 15-minute averages), which provide a general indication of system utilization. High load averages can suggest that the system is overutilized.
filesystem: This scraper gathers metrics related to file system usage, including total size, used space, and available space for each mounted file system. Monitoring file system usage helps prevent disks from becoming full, which can lead to application failures.
paging: The paging scraper collects metrics about the host's swap or page file usage, such as swap in and swap out rates. Excessive paging activity can indicate that the system is experiencing memory pressure.
processes: This scraper provides a count of the total number of processes running on the host.
process: This scraper allows for the collection of detailed metrics about specific processes running on the host. It typically requires further configuration to specify which processes to monitor and the specific metrics to collect (e.g., CPU usage, memory usage, I/O).
name: pods: This configuration instructs the receiver to collect information about Kubernetes pod objects.
mode: pull: The pull mode indicates that the receiver will periodically query the Kubernetes API server to retrieve the current state of all pod objects in the cluster.
interval: 60s: This parameter specifies how frequently the receiver will poll the API server for pod information. In this case, it will check every 60 seconds.
name: events: This configuration tells the receiver to collect Kubernetes event objects.
mode: watch: The watch mode utilizes the Kubernetes watch API, which allows the receiver to receive near real-time notifications whenever events occur in the cluster. This is more efficient than periodically polling, as the receiver only receives updates when changes happen.
endpoint: This parameter defines the URL of the Kubelet API endpoint. The configuration uses the environment variable K8S_NODE_NAME to dynamically determine the hostname or IP address of the current node. The standard Kubelet port for secure communication is 10250. The https:// scheme ensures that communication with the Kubelet is encrypted.
distribution: This parameter specifies the type of Kubernetes distribution being monitored. In this example, it is set to openshift, indicating that the metrics and logs are being collected from an OpenShift cluster. This information can be crucial for tailoring collection methods and interpreting cluster-specific data.
To limit the scope of event collection to specific namespaces, the namespaces parameter can be defined as a list of namespace names. This allows for focused monitoring and reduces the volume of event data being processed. In this example, the namespaces are commented out, so all namespaces will be collected.
Example:
      k8s_events:
        namespaces: [project1, project2]
Journald configuration breakdown:
files: /var/log/journal/*/: This parameter specifies the path to the journal files that the collector should monitor. The wildcard characters * allow for matching across different journal file directories and individual journal files within those directories. This ensures comprehensive log collection from all persistent journal logs.
priority: info: This setting defines the minimum severity level of logs to be collected. By setting it to info, the collector will gather all logs with a priority of info and higher (e.g., warning, err, crit, alert, emerg). This allows for filtering out less critical debug-level messages, reducing noise and focusing on more important events.
units: This section allows for filtering logs based on specific systemd units.
- kubelet: This entry specifies that logs originating from the kubelet systemd unit should be collected. The kubelet is the primary "node agent" in Kubernetes, responsible for running containers on a worker node. Collecting its logs is crucial for monitoring the health and status of pods and the node.
- crio: This entry indicates the collection of logs from the crio (Container Runtime Interface) unit. CRI-O is a lightweight container runtime for Kubernetes, and its logs provide insights into container lifecycle events, image management, and other runtime-related activities.
- init.scope: This entry configures the collection of logs from the init.scope unit. init.scope represents the system's initialization process and often contains essential boot-related information and early system messages.
- dnsmasq: This entry specifies the collection of logs from the dnsmasq unit. dnsmasq is a lightweight DNS forwarder and DHCP server commonly used in Kubernetes clusters for internal DNS resolution. Monitoring its logs can be helpful for diagnosing DNS-related issues within the cluster.
all: true: This boolean parameter, when set to true, instructs the collector to gather logs from all other journal entries that are not explicitly excluded by other filters (i.e., the units list). This acts as a catch-all to ensure that important system-level logs beyond the specified units are also captured.
retry_on_failure:: This section configures how the collector should handle failures during log collection.
You can find the complete OpenTelemetry collector on GitHub.
Depending on the receivers used, the collector needs different permissions. You will find the permissions in the documentation of each receiver. For the receivers listed above, the necessary permissions are available at the repo.
To install the collector with all necessary permissions, run the following:
Initially, our collector only logs the metrics collected by the receivers using the debug exporter. To fully leverage the collected metrics, we will now change the configuration to use OTLP/HTTP exporter, enabling the collector to send the gathered metrics data to a remote system accessible via HTTP using the OpenTelemetry Protocol (OTLP).
For demonstration and testing of the OpenTelemetry setup, we will deploy the following systems in a Red Hat Enterprise Linux virtual machine. These systems are essential for illustrating the complete data flow, from collection through processing to visualization and storage. The following systems are deployed in the VM:
Grafana: Grafana provides a robust platform for creating and displaying dynamic dashboards. It will be configured to connect to the metrics storage solution and present the collected data in a visually intuitive format, enabling detailed analysis and monitoring.
Mimir: Mimir is an open source time-series database system that serves as the primary storage for the metrics exported by the OpenTelemetry collector. Mimir's scalable architecture and efficient query engine make it ideal for handling large volumes of time-series data.
Loki: Loki is a horizontally scalable, highly available, multi-tenant log aggregation system. It will be used to manage and store log data, complementing the metrics data stored in Mimir.
Promtail: Promtail is an agent that collects logs from various sources and sends them to Loki. It will be configured to scrape logs from the OpenTelemetry collector and other relevant system components, ensuring that all relevant log data is captured and accessible in Loki.
Detailed, step-by-step instructions on how to deploy these systems in a virtual machine are not the scope of this article, but you can refer to the documentation for more information.
With Mimir up and running, we will now reconfigure the OpenTelemetry collector to send metrics to it. To do so, change the endpoint of spec.config.exporters.otlphttp.endpoint to reflect your environment:
#Change line highlighted below:
vi manifests/overlays/all/opentelemetry-collector.yaml
   exporters:
      debug:
        verbosity: basic
      otlphttp:
        endpoint: 'http://10.1.1.100:9009/otlp' #CHANGE IP
        tls:
          insecure: true
      otlphttp/logs:
        endpoint: 'http://10.1.1.100:3100/otlp' #CHANGE IP
        tls:
          insecure: true
You might need to add other parameters depending on TLS and other configurations you have on your external system. Check this documentation for more information about configuration parameters.
With the opentelemetry-collector.yaml properly configured, you can deploy the new collector.
#Delete the existing one, if exists
oc delete OpenTelemetryCollector otel -n k8s-otel
#Deploy the new one
oc apply -k manifests/overlays/all/
To verify the setup, add a new data source to Grafana for Mimir as follows:
Access Grafana at http://<IP>:3000/
Use admin / admin as the initial password. Set a new password for the admin user.
Go to Connections -> Add new connection.
Choose Prometheus and click Add new data source.
Enter the following details:
Name: Mimir
Prometheus server URL: http://<ip>:9009/prometheus
Authentication: None
Skip TLS certificate validation
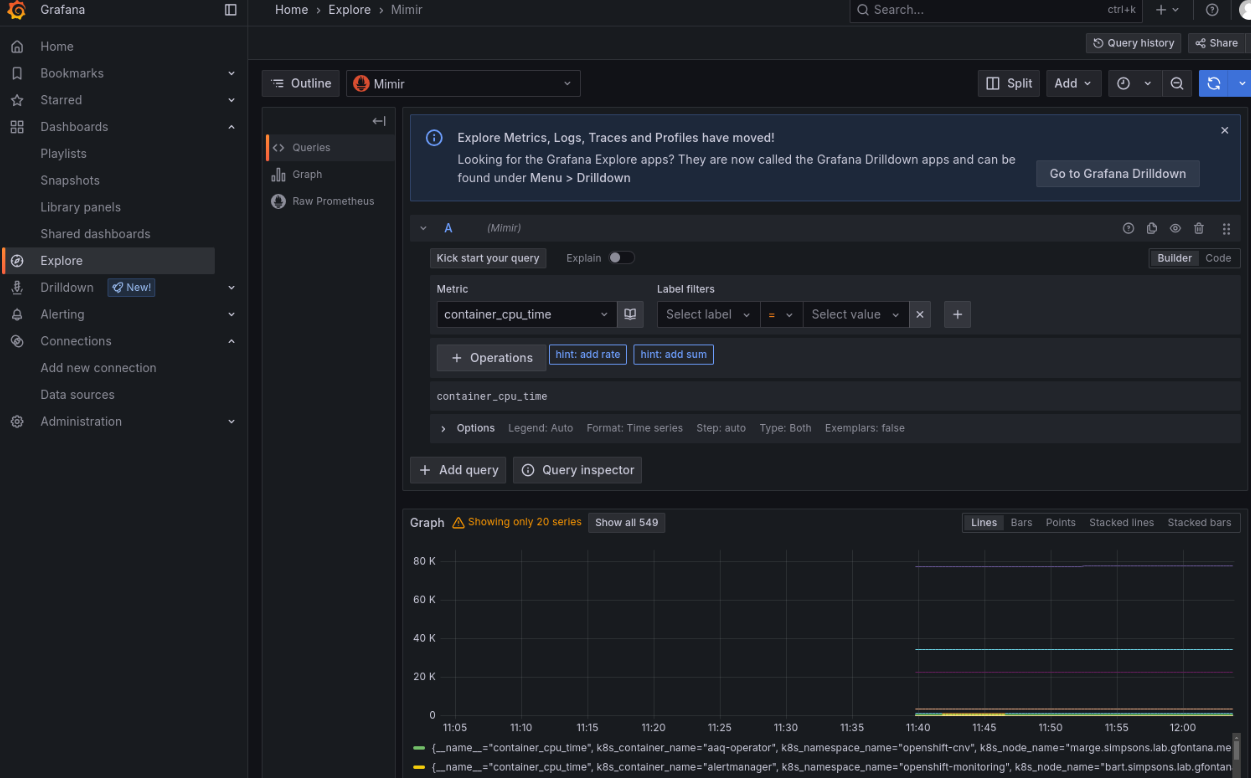
Then, use the Explore function. You should now see available metrics, like container_cpu_time (Figure 1).
Figure 1: The Grafana Explore feature, with Mimir data source, shows a metric collected and sent by OpenTelemetry.
Do the same for Loki:
Go to "Connections" -> "Add new connection".
Choose Prometheus and click "Add new data source".
Enter the following details:
Name: Loki
Prometheus server URL: http://<ip>:3100
Authentication: None
Skip TLS certificate validation
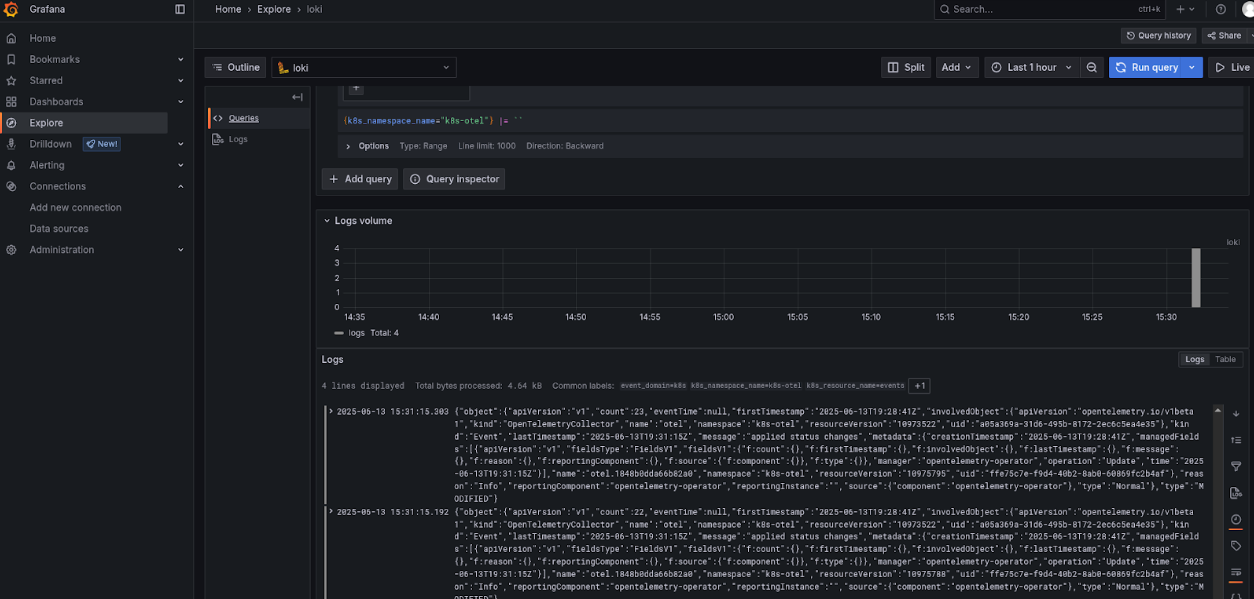
Then, use the Explore function. Select Loki, any filter (e.g., k8s_namespace_name=k8s-otel), and click on Run query, as shown in Figure 2.
Figure 2: The Grafana Explore feature, with Loki datasource, shows logs collected and sent by OpenTelemetry.
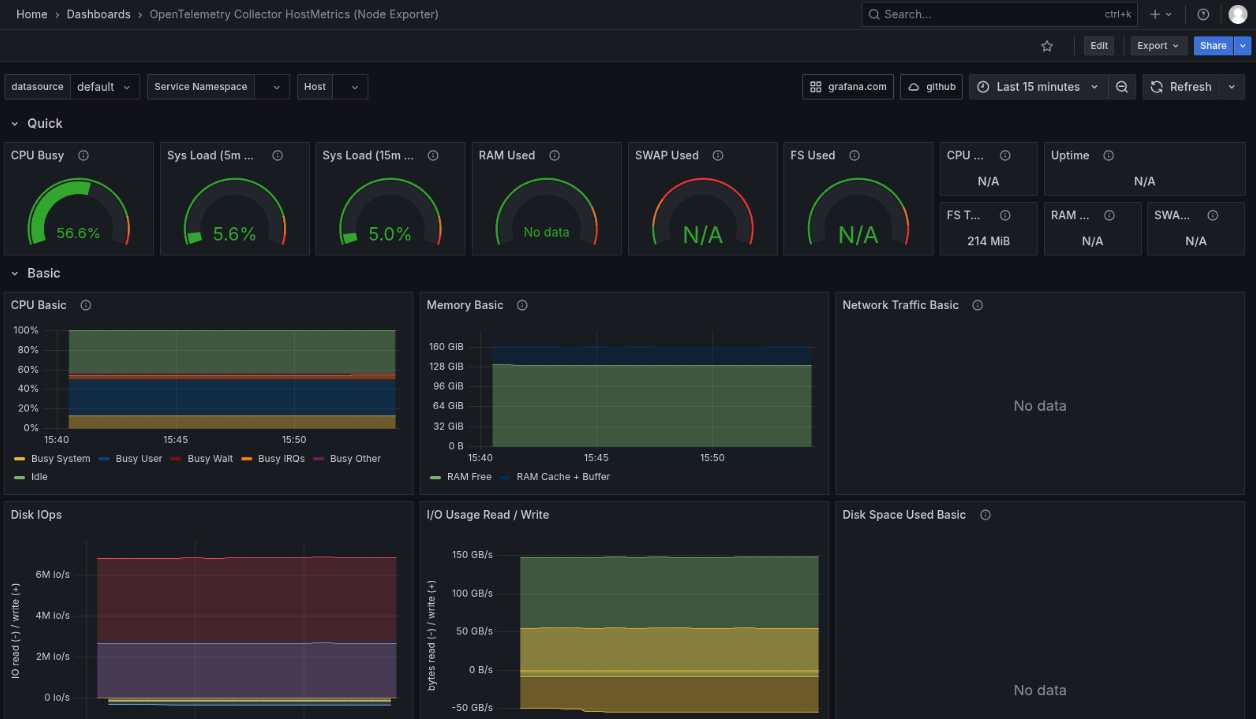
Enter 20376 and click the Load button, as shown in Figure 3.
Figure 3: This example of a Grafana dashboard shows graphs and statistics from metrics collected by OpenTelemetry.
Summary
Red Hat build of OpenTelemetry provides a powerful and flexible solution for comprehensive metrics and logs reporting in complex environments. By standardizing data collection, offering robust scalability, and providing enterprise-grade support from Red Hat, it simplifies observability and enables deeper insights into application and infrastructure health. With its seamless integration capabilities and a rich set of receivers, processors, and exporters, the Red Hat build of OpenTelemetry allows you to tailor your monitoring setup to meet your specific needs.
To fully leverage the capabilities of the Red Hat build of OpenTelemetry and enhance your monitoring strategy, explore the official documentation and community resources. Dive deeper into configuring collectors, setting up pipelines, and integrating with visualization tools like Grafana. You can find detailed information and getting started guides to help you implement and optimize your observability practices. Find out more about Red Hat build of OpenTelemetry and Red Hat OpenShift observability.