I’ve written a bit in the past about static analysis (CodeQL zero to hero part 1: Fundamentals of static analysis) and basics of writing CodeQL queries (CodeQL zero to hero part 2: Getting started with CodeQL). Today, I want to dig deeper about CodeQL and talk about variant analysis, writing a taint tracking query and various techniques for doing security research with CodeQL. As is with most IT skills, having practical, tangible experience with a tool will make it easier to remember and understand the concepts you learn, so this blog also contains challenges for each section. You will also find them in GitHubSecurityLab/codeql-zero-to-hero. Give them a try!
I use CodeQL quite extensively in my security research workflow to find vulnerabilities. Most of my (as well as my fellow team members’) disclosed vulnerabilities will give you an idea what kind of vulnerabilities you can find using CodeQL. Let’s jump in!
Querying for specific library methods
In the previous blog post we were matching function calls, functions, and method calls based on a name, for example, in this challenge. It could happen though, that a certain method call is defined in several libraries, and we wanted to refine our results to only the method call from one specific library.
For example, when auditing a new codebase, we might want to find calls to a specific library function or method, because we know it might be a new source or a sink (see part one of this series). We can do just that with static analysis and CodeQL. So, how do we write and query for specific library methods? Let’s take our earlier example and say we are auditing a Django application for SQL injection and we are interested in execute() calls that come from, and only from, django.db.connection.cursor().
To execute custom SQL directly in django we need to grab the cursor object by calling connection.cursor() from the django.db.connection, on which we call execute(). Generally, it would look like this:
from django.conf.urls import url
from django.db import connection


def show_user(request, username):
    with connection.cursor() as cursor:
        cursor.execute("SELECT * FROM users WHERE username = %s" % username)
In CodeQL for Python, we use the API graphs library to refer to external library functions and classes. For dynamic languages, we cannot uniquely determine the type of a given variable due to their dynamic nature, and, therefore, the API graph layer offers the mechanism to track types from their import to potential uses.
We can find all execute method calls from the django.db library with the following query.
/**
 * @id codeql-zero-to-hero/3-1
 * @severity error
 * @kind problem
 */

import python
import semmle.python.ApiGraphs

from API::CallNode node
where node =
    API::moduleImport("django").getMember("db").getMember("connection").getMember("cursor").getReturn().getMember("execute").getACall()
    and
    node.getLocation().getFile().getRelativePath().regexpMatch("2/challenge-1/.*")

select node, "Call to django.db execute"
Let’s walk through what is happening in the query.
First, we set query metadata. The most interesting part of it is @kind problem. It means that the results for each node will contain the filename the sink was found in, and the string that we specify in the select clause. All in all, it makes the results display prettier.
Then, we define that we are looking for API::CallNodes, so nodes that are connected to the API graph (see docs for the API module) in the from clause.
In the where clause, we filter for nodes coming from the django library with API::moduleImport("django"). Then, we find references to the cursor with .getMember("db").getMember("connection").getMember("cursor"). That would match django.db.connection.cursor. Since we call execute on the cursor object, we first need to use getReturn() predicate to get the node which represents the result of creating the cursor object—this returns us django.db.connection.cursor() (note the parentheses at the end). At last, we get the node representing the execute method with getMember("execute") and with getACall() we get the actual method call to the method represented by the execute node.
It might look complicated at first, but it isn’t really. After using it a few times it becomes quite intuitive.
django.db library
Set up CodeQL using one of the methods presented in challenge 2 from CodeQL zero to hero part 2 to run the queries. Remember also to download and select a CodeQL database—it can be the GitHubSecurityLab/codeql-zero-to-hero database, but you may also choose another project.
Run the above query to find all method calls that are called execute and come from the django.db library.
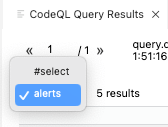
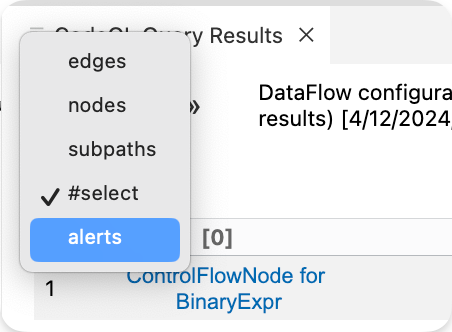
If the path is not displaying properly, you may need to change the view to alerts.
os.system method calls
Now you know how to query for calls to functions from specific libraries. If os.system executes input coming from a user, it could lead to a command injection. Write a query to find calls to os.system and run it on the database you selected in the previous challenge.
See solution in GitHubSecurityLab/codeql-zero-to-hero.
Flask is a popular Python web framework. Web frameworks very often introduce potential sources for untrusted data, Flask request being one of them. For example, a source of untrusted data could be:
username = request.args.get("username")
Write a query to find request.args
See solution in GitHubSecurityLab/codeql-zero-to-hero.
getAQlClass predicate
Run the above query and observe the results—for example, MethodCallNode, ExecuteMethodCall and SqlExecution.
Taint analysis in CodeQL—taint tracking
I briefly mentioned how CodeQL implements taint analysis in part two of CodeQL zero to hero. There was also a challenge presenting how to run the built-in CodeQL queries using taint analysis, which you should definitely try out!
Now that we went through the basics of CodeQL, we can write our own query that will find the flow from the source to the sink.
But first, let’s start with the differences between data flow analysis and taint flow analysis. Taint flow analysis allows us to track non-value preserving steps. Data flow analysis does not. For example, if a tainted string is concatenated with another string or if it is assigned to an attribute of an object, taint flow analysis will allow us to continue tracking it through the flow, while data flow analysis will not. See CodeQL zero to hero part 1 for more information about data flow analysis and taint analysis.
Local data flow
Before we dig into taint analysis, we need to introduce two (sub)types of data flow analysis: local data flow and global data flow, as well as local taint flow and global taint flow.
In CodeQL, local data flow refers to tracking the data flow locally, for example, within a single function. It is cheaper to compute than global data flow. Local taint flow (in CodeQL called local taint tracking) allows us to track non-value-preserving flow steps.
For example, with local data flow, we could make our analysis more accurate by querying for all django.db’s execute calls that do not take a string literal. If an execute call takes a string literal, for example:
cursor.execute("SELECT * FROM users WHERE username = 'johndoe'")
Or:
query = "SELECT * FROM users WHERE username = 'johndoe'"
cursor.execute(query)
Then, it does not take any user input, and we already know it is not vulnerable to SQL injection and we might want to exclude these from our analysis.
We could query for all django.db’s execute calls that do not take a string literal, with the below query:
/**
 * @id codeql-zero-to-hero/3-5
 * @severity error
 * @kind problem
 */
import python
import semmle.python.ApiGraphs

class ExecuteCall extends DataFlow::CallCfgNode {
        ExecuteCall() {
        this = API::moduleImport("django").getMember("db").getMember("connection").getMember("cursor").getReturn().getMember("execute").getACall()
        }
}

predicate executeNotLiteral(DataFlow::CallCfgNode call) {
        exists(DataFlow::ExprNode expr |
                call instanceof ExecuteCall
                and DataFlow::localFlow(expr, call.getArg(0))
                and expr instanceof DataFlow::LocalSourceNode
                and not expr.getNode().isLiteral()
        )
}

from DataFlow::CallCfgNode call
where executeNotLiteral(call)
select call, "Call to django.db execute with an argument that is not a literal"
To spice things up, this time I used a class and a predicate. A class allows you to define your own types in CodeQL. Types represent sets of values. A predicate is like a function. It encapsulates a portion of logic in a program and makes it easier to test certain code. Classes and predicates were introduced in the previous blog.
Let’s do our usual dance with explaining the query  :
:
- The class
ExecuteCallrepresentsdjango.db’sexecutemethod call that we modeled earlier. - The predicate
executeNotLiteraltakes an input—a call control flow graph nodecall. - In the predicate, we use the
exists()construct, which allows us to define local variables. Here we define anExprNode, which is an expression. - We specify that the
callhas to be any call node of typeExecuteCall. - Then, we look for local flow between any expression
exprand the first argument ofcall. - Next, we limit the expression
exprto any local sources, for example, within a function. - At last, with
not expr.getNode().isLiteral()we limit the local sources to not be a literal of any kind: integer, string, etc. - In the
from-where-selectquery, we specify that we are looking for any call (from DataFlow::CallCfgNode call), then limit it to the conditions defined in the predicate (where executeNotLiteral(call)), and then select that call (select call).
Note again that CodeQL is a declarative language—the order of specifying conditions does not matter. In the predicate, we first looked for a local flow from any expression to any first argument to execute and only afterwards we limited expr to be a LocalSourceNode and not a literal. That's not a problem; we can switch the order of conditions as we like.
execute calls that do not take a string literal
If we used, for example, grep to find anything called execute, we might have found calls from other libraries that are also called execute and we wouldn’t have been able to filter out the ones with a string literal.
Global data flow (and global taint flow)
In CodeQL, global data flow refers to tracking the data flow throughout the whole codebase. We do this by using a taint tracking configuration, where we specify a source and a sink to find the flows between the two.
Global taint flow is exactly what we use in most of our queries to find variants of vulnerabilities in codebases. You can see all the queries that we use in the github/codeql repository. For example, CodeQL for Python stores all its security related queries in the python/ql/src/Security/ folder and experimental queries in the python/ql/src/experimental/Security folder.
In August 2023, a new, improved version of taint tracking API was announced, which means that we have two ways of writing the configuration. The older version will be deprecated within two or so years, so it’s preferred that you use the new API. I’m going to mention both versions in this blog post for clarity, because there are many older blog posts about CodeQL, which use the old configuration.
New taint tracking API
Let’s start by looking at the way we write the new taint tracking configuration:
/**
 * @kind path-problem
 */

import python
import semmle.python.dataflow.new.DataFlow
import semmle.python.dataflow.new.TaintTracking
import semmle.python.ApiGraphs
import MyFlow::PathGraph

private module MyConfig implements DataFlow::ConfigSig {
  predicate isSource(DataFlow::Node source) {
    // Define your source nodes here.
  }

  predicate isSink(DataFlow::Node sink) {
    // Define your sink nodes here.
  }
}

module MyFlow = TaintTracking::Global<MyConfig>; // or DataFlow::Global<..>

from MyFlow::PathNode source, MyFlow::PathNode sink
where MyFlow::flowPath(source, sink)
select sink.getNode(), source, sink, "Sample TaintTracking query"
A few things to note:
- To be able to see the path between source and a sink, we add
@kind path-problemin the metadata. This makes it a so-called “path query.” - For results to be displayed properly, the
selectneeds 3 nodes and a comment string, here implemented withselect sink.getNode(), source, sink, "Sample TaintTracking query". - Note we also need to import the module that we create with
import MyFlow::PathGraph.
What is happening in the query:
- We create a new module
MyConfigwhich implementsDataFlow::ConfigSig. This means that it can be used as an input configuration for data flow and that we must define some predicates with certain names and numbers of arguments in the module. - The required predicates are
isSourceandisSink. We define the sources in theisSourcepredicate and sinks in theisSinkpredicate. There are optional predicates, likeisBarrierandisAdditionalFlowStep, which can be used to adjust what flow is considered (see more in the documentation), but they are beyond the scope of this blog post. - Next, we create a global TaintTracking computation,
MyFlow, by parameterizingTaintTracking::Globalusing the sources and sinks we've defined inMyConfigin the linemodule MyFlow = TaintTracking::Global<MyConfig>. - At last, we check that there is a flow path between the source and the sink with
where MyFlow::flowPath(source, sink).
Now that we know the building blocks, let’s try to use it. Let's say we want to find a SQL injection from any user input to django.db ’s execute sink.
We could use a Flask request as a source. It is fairly easy to model. Then, we can reuse the execute sink we already modeled in the previous sections.
The final query will look like this:
/**
 * @kind path-problem
 * @problem.severity error
 * @id githubsecuritylab/3-6
 */

 import python
 import semmle.python.dataflow.new.DataFlow
 import semmle.python.dataflow.new.TaintTracking
 import semmle.python.ApiGraphs
 import semmle.python.dataflow.new.RemoteFlowSources
 import MyFlow::PathGraph

 class ExecuteCall extends DataFlow::CallCfgNode {
    ExecuteCall() {
    this = API::moduleImport("django").getMember("db").getMember("connection").getMember("cursor").getReturn().getMember("execute").getACall()
    }
}

 private module MyConfig implements DataFlow::ConfigSig {
   predicate isSource(DataFlow::Node source) {
     source = API::moduleImport("flask").getMember("request").asSource()
   }

   predicate isSink(DataFlow::Node sink) {
     exists(ExecuteCall ec |
         sink = ec.getArg(0)
        )
   }
 }

 module MyFlow = TaintTracking::Global<MyConfig>;

 from MyFlow::PathNode source, MyFlow::PathNode sink
 where MyFlow::flowPath(source, sink)
 select sink.getNode(), source, sink, "execute sink called with untrusted data"
- In the
isSourcepredicate, we define our source to be an import of a Flask request. In a similar way as with the sink, we get theflasklibrary and the references to therequest. Then, withasSource(), we get the data flow node, whereflask.requestenters the database. Note that withasSource()we moved from the API graph to the data flow graph. - In the
isSinkpredicate, we define our sink to be the first argument to anyExecuteCallnode withexists(ExecuteCall ec | sink = ec.getArg(0))
execute sink
Run the above query. If the path is not displaying properly, you may need to change the view to alerts.
Old taint tracking configuration
We encourage you to use the new configuration, but for historical purposes we are including the old configuration here—there are many articles, conference talks, research papers about CodeQL, and some older CodeQL queries, which use the old configuration, and describing it shortly here should make it easier to understand how the older queries worked. The old configuration looks like this:
/*
 * @kind path-problem
 */

import python
import semmle.python.dataflow.new.TaintTracking

class MyConfig extends TaintTracking::Configuration {
  MyConfig() { this = "MyConfig" }

  override predicate isSource(DataFlow::Node source) {
    ...
  }

  override predicate isSink(DataFlow::Node sink) {
    ...
  }
}

from MyConfig config, DataFlow::PathNode source, DataFlow::PathNode sink
where
    config.hasFlowPath(source, sink)
select sink.getNode(), source, sink, "Sample Taint Tracking query"
In the old taint tracking configuration, we have to import the taint tracking module and then create a new myConfig class by extending it.
If you’d like to reuse a query you see in an article that uses the old taint tracking configuration, it should be possible in most cases. For others, I suggest translating the query from the old taint tracking configuration into the new one. See the changes and how to translate them here.
There were also a few changes in how the partial path graph is used. If this is something you expect to use in your query or during audit, please consult the documentation for how to use these. Other questions? Please ask in the GitHub Security Lab server on Slack.
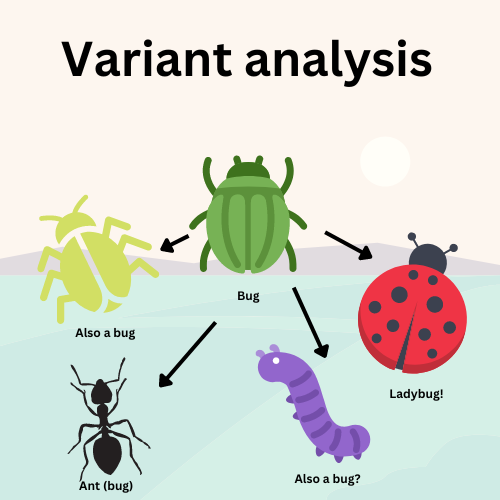
Variant analysis
Probably one of the most interesting aspects of CodeQL is variant analysis.
Variant analysis is a process, in which a known issue, for example, a specific vulnerability, is taken as a base for finding other variants—occurrences—of that vulnerability in source code.
On a few occasions when I was auditing a specific codebase and found one vulnerability, variant analysis helped me find other variants of that vulnerability that I might otherwise have missed (or it would take me much longer to find them). Once, I happened to audit a codebase that had over twenty variants of the same vulnerability. Having CodeQL report on all the variants and their flow paths was invaluable, even just to keep track of the vulnerabilities I already triaged.
As an example,let’s say we have an application with a SQL injection. The source of the vulnerability comes from a function displaying information about a user, called show_user(), which takes unsafe, user-supplied input from a Flask (popular Python web framework) GET request parameter and uses it in cursor.execute() from the MySQLdb library without sanitization.
def show_user():
    username = request.args.get("username")
    with connection.cursor() as cursor:
        cursor.execute("SELECT * FROM users WHERE username = '%s'" % username)
Variant analysis could be used to detect that specific vulnerability, and if there are other variants of SQL injection in the codebase. It makes auditing applications much quicker.
A variant of this vulnerability could be another Flask GET request parameter in our example application—for example, a function displaying a specific product, called show_product() whose input ends up in another cursor.execute() from MySQLdb library sink somewhere else in the application. In this case, our “base” vulnerability is SQL injection originating from any Flask GET request parameter to any execute MySQLdb library sink within the same codebase. Using QL, we can “model” in CodeQL the Flask GET request parameter as source, and cursor.execute() from MySQLdb as a sink and check for connection (flow) between the two.
So, what we are looking for are vulnerable patterns. Once this base vulnerability is modeled, we can use it to query not only this example application, but we can use that “vulnerable pattern” to also query any other Python application. We will be doing it later in the blog post.
All in all, running variant analysis allows us to quickly identify issues in huge modern code bases with little effort. On top of that, we can run variant analysis at scale by scanning hundreds of repositories for such vulnerable patterns at the same time. GitHub developed a tool for it, called multi-repository variant analysis (MRVA), which can run a query for a specific vulnerability in a thousand projects at once. We will expand on MRVA later in the blog because it will likely become an essential tool in your toolbox for finding vulnerabilities at scale.
To sum up: CodeQL is able to discern the code that is a source in a given codebase, the code that is a sink, and check if there is a connection between the two. To do that, it uses models of such sources and sinks, and is able to detect the flow between them using data flow analysis and taint analysis.
Source and sink models in CodeQL
CodeQL, as well as many other static analysis tools, mark certain code in certain libraries as a source or as a sink. In CodeQL, we call that process “modeling” sources and sinks. It’s a common approach used by many static analysis tools and generally, the more models of frameworks and libraries the tool supports, the better.
CodeQL has a very rich library and framework support—many libraries and frameworks are already modeled in CodeQL, with their sources and sinks. There are hundreds of sources and sinks, categorized for each vulnerability type. By using specialized queries for each vulnerability type, CodeQL checks for a data flow path between these predefined sources and sinks. In this way, CodeQL is able to detect the majority of existing vulnerabilities in a codebase, as long as said vulnerabilities can be detected using static analysis.
Sources
How can CodeQL tell what is a source and what is not? For CodeQL to be able to detect that a Flask HTTP request is a source, the Flask framework has to be modeled in CodeQL and certain function calls have to be defined in CodeQL as sources. This is done in qll files (as opposed to ql files, which are used for queries). For example, you can see the models for flask in the CodeQL repository. Specifically, the flask request is defined here.
API::Node request() { result =
API::moduleImport("flask").getMember("request") }
Since many vulnerabilities have common sources, but different sinks, there was introduced a type called RemoteFlowSource in CodeQL for Python, which contains all predefined sources.
The Flask request that we introduced earlier is modeled as a remote flow source here.
private class FlaskRequestSource extends RemoteFlowSource::Range {
  FlaskRequestSource() { this = request().asSource() }

  override string getSourceType() { result = "flask.request" }
}
This is very interesting for us security researchers  , because we can query for all RemoteFlowSources in an application to get a quick overview of all places that user input enters an application. This can help us map the attack surface. We will use it later in the blog and in the challenges.
Sinks
When frameworks and libraries are modeled, certain code is categorized as certain types of sinks. In CodeQL for Python, we have a type for sinks for each vulnerability—there’s a type for SQL injection sinks, for path injection, for deserialization, and others. The sinks, for example, SqlExecution, are defined in the Concepts module.
class SqlExecution extends DataFlow::Node instanceof SqlExecution::Range {
  /** Gets the argument that specifies the SQL statements to be executed. */
  DataFlow::Node getSql() { result = super.getSql() }
}
Most database libraries in Python follow the PEP249 Specification (Python Database API Specification), so instead of modeling each database library separately, the CodeQL for Python team implemented a model for PEP249 which all database libraries implement in their models. For example, MySQLdb library is modeled here, by extending the PEP249 module.
The cursor.execute method is modeled in the PEP249 module here. However, the case with having a PEP specification for several libraries is not that usual.
private class ExecuteMethodCall extends SqlExecution::Range, API::CallNode {
  ExecuteMethodCall() {
    exists(API::Node start |
      start instanceof DatabaseCursor or start instanceof DatabaseConnection
    |
      this = start.getMember(getExecuteMethodName()).getACall()
    )
  }

  override DataFlow::Node getSql() {
    result in [this.getArg(0), this.getArgByName(getSqlKwargName()),]
  }
}
As we can see, it extends SqlExecution. Again, this can be interesting for us researchers.
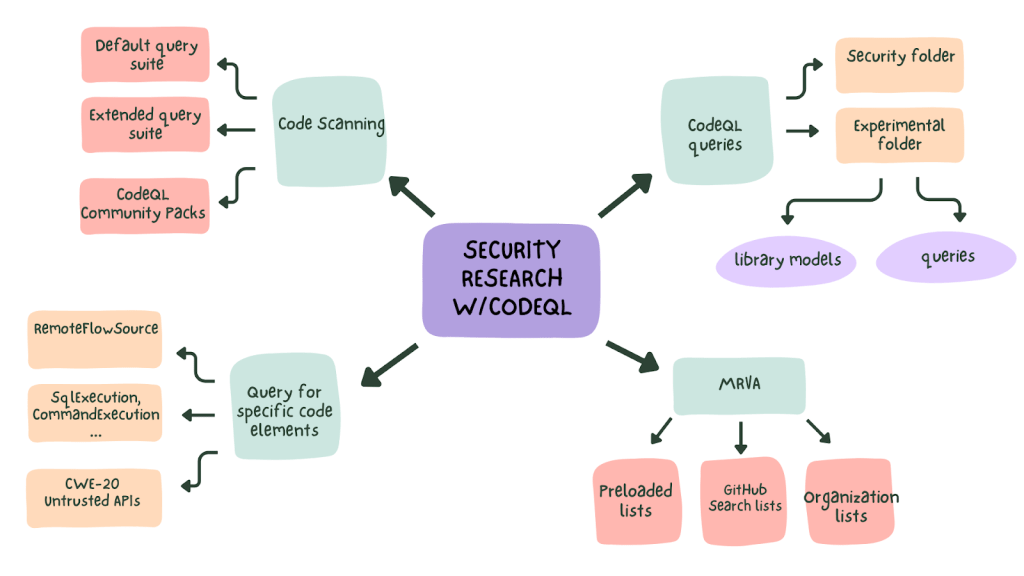
Security research methodology with CodeQL—approaching a new target
Now that we learned about the building blocks of CodeQL, we can move on to doing our own research with CodeQL.
There’s no “one size fits all” approach to code review methodology, but there are common actions that we usually do when approaching a new target during an audit. In this section, I want to look at general methodology used during security research and how to use CodeQL in each of its phases. Check out also the blog post about doing research with GitHub tools written by my colleague, Jorge Rosillo. It’s a case study which names tools and techniques that you can use for security research.
In CodeQL zero to hero part 2, we mentioned that CodeQL can help us with manual audits by answering questions:
- What is my attack surface? Where should I start my audit?
- What are the sources (unsafe user-supplied input) in my code base?
- What are the sinks (dangerous functions)?
- Do the sources end up in any dangerous or untrusted functionality?
- Which parts of code are high in bug density and could be vulnerable?
Let’s have a look at how CodeQL can help us answer these questions.
Quick look with code scanning
The easiest way to get started with approaching a new target with CodeQL is to enable code scanning on it.
Code scanning will run the security queries that are in the default suite (in the default automated setup, that we used in challenge 1), that is most of the queries that are in the <language>/ql/src/Security/ folder.
If you prefer, you can enable the security-extended suite, which includes queries with lower precision and severity. This will give you an idea of what could be exploitable and any interesting points in the code that you could investigate further. If something has caught your attention, you could write queries to find other similar sources, sinks or patterns.
If you’d like even more inspiration, GitHub Security Lab has you covered— we decided to share some of our audit queries in GitHubSecurityLab/CodeQL-Community-Packs. Follow the instructions to enable them in your code scanning setup.
Run specific queries or parts of queries
After having an initial look at the target with code scanning, we can move on to reviewing the target for specific types of vulnerabilities with CodeQL in your local preferred CodeQL setup.
A good start is to run the queries in the <language>/ql/src/Security/ folder separately as we did in the previous blog post. You could also edit the queries, if you are looking for something specific.
You can also run several queries at once (or all of them) locally, by right clicking a folder with queries, for example, the Security folder, and then selecting “Run queries in selected files.”
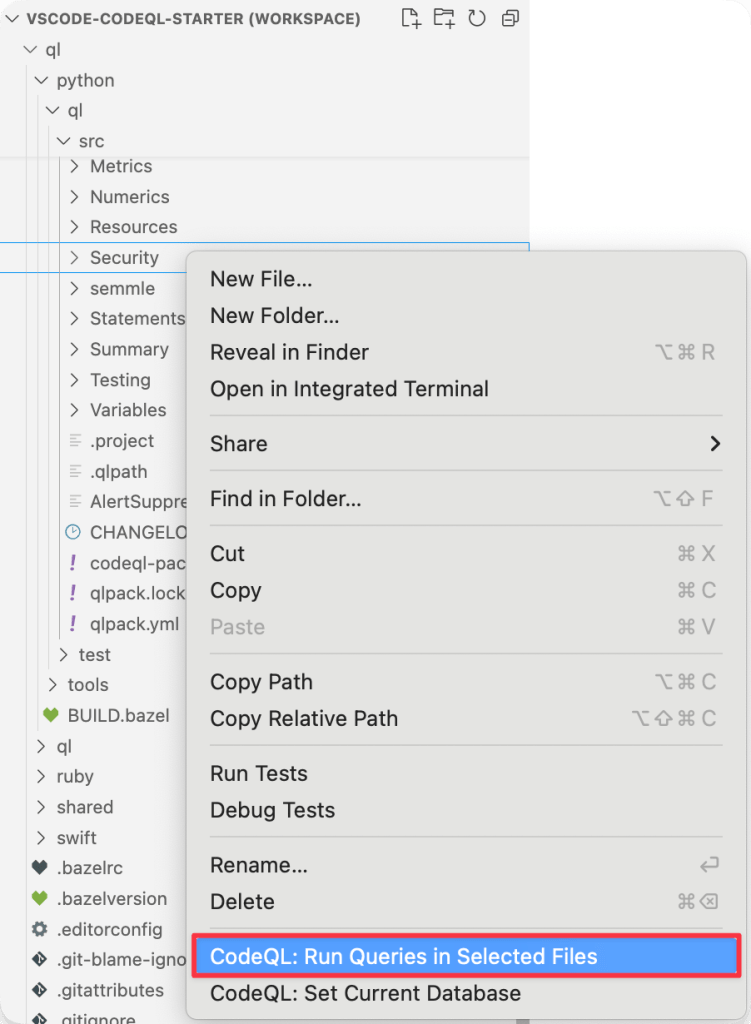
You will need to use the VS Code CodeQL Starter Workspace for this challenge. See setup.
CodeQL for Python stores all its security related queries in python/ql/src/Security/ folder and experimental queries in python/ql/src/experimental/Security. The folder structure might differ a bit for other languages, for example Ruby in ruby/ql/src/queries/security or C# in csharp/ql/src/Security Features.
Find all sources with the RemoteFlowSource type
In the previous section, we mentioned that all sources of untrusted data are modeled as RemoteFlowSource type. The source models can give us an overview of a codebase’s attack surface and give starting points to research.
We can use that type to query for all sources of untrusted data in a codebase and all entry points to an application. Using CodeQL for Python, we can query a CodeQL database like so:
/**
 * @kind problem
 * @problem.severity error
 * @id githubsecuritylab/3-8
 */
import python
import semmle.python.dataflow.new.RemoteFlowSources

from RemoteFlowSource rfs
select rfs, "A remote flow source"
Getting all the possible sources is an easy way to start an audit of an application. Remember that if you want to limit what files are scanned for sources, you can use the built-in predicates such as getLocation, as we did in the previous blog.
Find all the sources in the provided database using the RemoteFlowSource type.
Feel free to choose a different project to query on; maybe you’ll find something interesting? To download a CodeQL database for any open source project on GitHub, check setup instructions.
Find all sinks for a specific vulnerability type
In a similar way as with sources, we could query for all SQL injection sinks within a codebase. It’s especially useful if it happens that an application uses more than one database library. We could do it by using the Quick evaluation functionality introduced earlier. Go to the SqlInjection.ql query located in python/ql/src/Security/CWE-089/SqlInjection.ql and move your mouse cursor over the module SqlInjectionQuery in the second import statement.
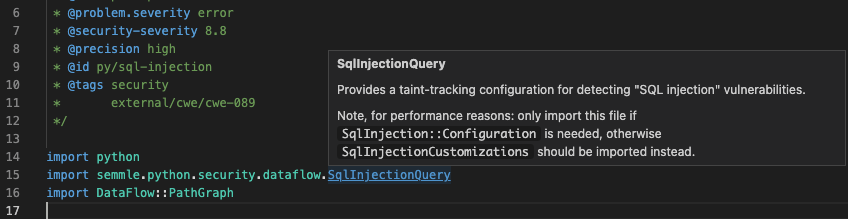
This module is where most of the logic for the query is defined. Right click on the SqlInjectionQuery and choose the “Go to definition” option. This will move you to the file with the module.
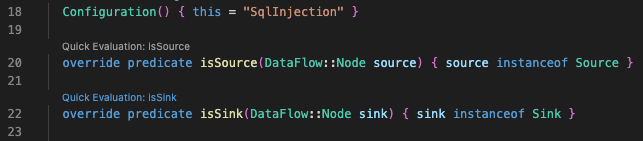
Let’s say we are interested in all SQL injection sinks. These are all included by the isSink predicate. If you look just above the isSinkpredicate over line 22, you will see the “Quick evaluation: isSink” option. Click it and you should see all the SQL injection sinks in a given database. Alternatively, you can right click and then choose “CodeQL: Quick evaluation”. If you are having issues with running the query, make sure that you have a Python CodeQL database selected (see setup).
This way of querying for sinks is faster, but not as flexible. We cannot really edit the queries, unless we wanted to edit the SqlInjectionQuery module.
Another way we could get all the sinks is by querying for the SqlExecution type in the codebase. We could query for all SQL injection sinks like below.
/**
 * @kind problem
 * @problem.severity error
 * @id githubsecuritylab/3-9
 */

import python
import semmle.python.Concepts

from SqlExecution sink
select sink, "Potential SQL injection sink"
Many of the sinks we use in CodeQL for Python, including SqlExecution, are defined in the Concepts module, for example, CodeExecution, XPathConstruction, and more. The advantage of using this method is that it is done in a separate file and this way you could add any conditions to the query, if you want to.
Find all the SQL injection sinks. See what other sinks are available in Concepts and try to query for them.
Feel free to choose a different project to query on.
Some of the queries do not use the Concepts module, for example, the cleartext logging query, defined in CleartextLogging.ql. In that case, you would have to look into the implementation of the query in the qll files: CleartextLoggingQuery.qll and CleartextLoggingCustomizations.qll. In CleartextLoggingCustomizations.qll, we can see several kinds of sinks: first, there is LoggingAsSink sink, which uses the Logging sinks that are defined in the Concepts module, but there is also another sink class defined—PrintedDataAsSink. See below for a shortened version of the code from the link.
/** A piece of data logged, considered as a flow sink. */
  class LoggingAsSink extends Sink {
    LoggingAsSink() { this = any(Logging write).getAnInput() }
  }

  /** A piece of data printed, considered as a flow sink. */
  class PrintedDataAsSink extends Sink {
    PrintedDataAsSink() {
      (
        this = API::builtin("print").getACall().getArg(_)
        or
        this =
          API::moduleImport("sys")
              .getMember(["stdout", "stderr"])
              .getMember("write")
              .getACall()
              .getArg(0)
      ) and
      not exists(Module loggingInit |
        loggingInit.getName() = "logging.__init__" and
        this.getScope().getEnclosingModule() = loggingInit and
        not exists(loggingInit.getFile().getRelativePath())
      )
    }
  }
}
Note that there are very few sinks implemented this way for Python—most sinks are in Concepts.qll. The sinks implement the Range design pattern, which allows for both easy extension and refinement of classes.
Many languages use the Concepts module, for example, Go’s Concepts is defined here. Note though, that even though a language uses Concepts, you may still need to look into the implementation of a particular path query to find their sinks, just like in the case with CleartextLogging query.
Find calls to all external APIs (untrusted functionality)
“CWE-20 Untrusted APIs” query is a special query that is very interesting for security researchers. It detects if data from untrusted sources is used by any external APIs. By “external APIs” we understand anything that is outside of a codebase—calls to methods from libraries and others. Any code that is not defined in our codebase is considered untrusted and could be interesting from a security researcher’s point of view. In that way, this query covers sinks from many vulnerability categories at once. It is also very useful to identify third- party APIs that may require modeling if we want the taint tracking analyzer to continue the analysis after it.
@frycos presented how he found a pre-authentication remote code execution in 20 minutes using this query in this article.
Run the CWE-20 Untrusted APIs query on a repo of your choice. For Python in the VS Code CodeQL Starter Workspace, it is located in vscode-codeql-starter/ql/python/ql/src/Security/CWE-020-ExternalAPIs/UntrustedDataToExternalAPI.ql.
Try to choose a new project, download its database from GitHub (see setup) and run this query on it.
Next steps
After you have identified any interesting areas, the next step would be to verify them. If you suspect that the vulnerability you’ve found could be a candidate for variant analysis, you might want to use QL to model it and see if there are other variants of the vulnerability in that codebase or other codebases.
Sometimes it might be hard to decide whether to model a vulnerability using CodeQL, or not. Generally, I advise you to have a look at security research using CodeQL that was published by the security community. More on that in the “Community research with CodeQL” section.
Multi-repository variant analysis (MRVA)
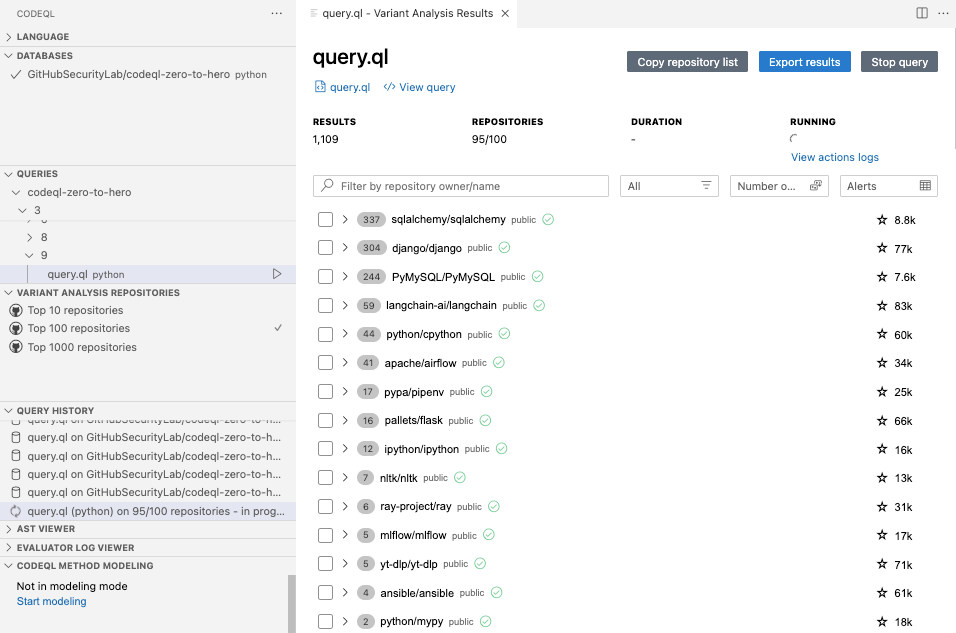
We mentioned the tool MRVA in the “variant analysis” section. MRVA is a tool which can run a given CodeQL query against a thousand projects at once. You can run any CodeQL query using MRVA, be it prewritten or your own. As you can see, it’s a very powerful tool for doing security research at scale. For example, you could run the prewritten SQL injection query against the top 1,000 Python projects or any other security query and then choose the top 1,000 projects for that language.
Say you have created a new query to find variants of a certain vulnerability—it could be Log4Shell, for example. If the vulnerability you modeled is novel, by using MRVA, you may be able to detect tens of vulnerabilities across hundreds of open source projects all within a few clicks. Thanks to these features, using CodeQL together with MRVA has become popular with security researchers.
Let’s try to run MRVA with an existing query.
Set up MRVA using instructions here. Select top 10 repositories in the CodeQL extension tab. Choose one of the prewritten queries in your favorite language, right-click in the query file, and select CodeQL: Run Variant Analysis to start variant analysis. If you don’t find anything using that query, it’s likely because the project is already secured against that vulnerability. If you prefer, run one of the bigger lists with 100 or 1,000 repositories.
Note: if you do find true positive vulnerabilities, make sure to verify them first and then report them using the coordinated disclosure process. See our guide for reporting vulnerabilities to open source.
MRVA comes with predefined lists of top 10, top 100 and top 1,000 projects available on GitHub for any language, but you can also add your own list of projects. MRVA allows you to create your own list of projects using GitHub’s code search functionality. See how to use it here.
Community research with CodeQL
There has been a lot of great security research published with CodeQL and I’d like to highlight some of it in this section. I hope it inspires you in your own research.
| Note: Many resources mention the LGTM platform, which was deprecated in 2022 after the launch of code scanning. You can use the VS Code Starter Workspace setup to run the same queries as in the articles, or use MRVA to run the query against multiple projects at once. |
Python
- Pre-Auth RCE with CodeQL in Under 20 Minutes
Writeup by @frycos in which they describe how they found a pre-authentication remote code execution in 20 minutes in pgAdmin using the CWE-20 Untrusted API query. - Practical Introduction to CodeQL
Practical writeup of how @jorgectf wrote new QL queries for detecting XXE, LDAP injection, and regular expression injection, which were later rewarded in the CodeQL bug bounty program and merged into the CodeQL repository upstream.
Java
- Apache Dubbo: All roads lead to RCE
A deep dive into auditing Apache Dubbo with CodeQL by @pwntester. It includes analyzing Dubbo architecture, identifying sources, and modeling the ones that weren’t reported by CodeQL. Thirteen new deserialization vulnerabilities were reported as a result of the research. @pwntester also created a CodeQL workshop with a step by step guide to write the queries that he wrote for auditing Dubbo. See the video and accompanying repository. - Vulnerability digging with CodeQL
Writeup about modeling a Java deserialization vulnerability in CodeQL by @mtimo44 and @h0ng10.
C/C++
- Bug Hunting with CodeQL in Rsyslog
Beginner-friendly step by step process of finding vulnerabilities using CodeQL in Rsyslog by @agustingianni. - Hunting bugs in Accel-PPP with CodeQL by Chloe Ong and Removing False Positives in CodeQL by Kar Wei Loh.
The two researchers worked together to find memory corruption bugs in Accel-PPP. The first article is an in-depth writeup about looking for the bugs and the thought process, writing CodeQL and the challenges they’ve encountered. The second article shows how they refined the CodeQL query to provide more precise results. - Finding Gadgets for CPU Side-Channels with Static Analysis Tools
Research by @pwningsystems and @fkaasan into finding useful gadgets in CPU side-channel exploitation.
Reach out!
If CodeQL and this post helped you to find a vulnerability, we would love to hear about it! Reach out to us on GitHub Security Lab on Slack or tag us @ghsecuritylab on X.
If you have any questions, issues with challenges or with writing a CodeQL query, feel free to join and ask on the GitHub Security Lab server on Slack. The Slack server is open to anyone and gives you access to ask questions about issues with CodeQL, CodeQL modeling or anything else CodeQL related, and receive answers from a number of CodeQL engineers and security researchers from GitHub Security Lab (me included!). If you prefer to stay off Slack, feel free to ask any questions in CodeQL repository discussions or in GitHub Security Lab repository discussions.
The post CodeQL zero to hero part 3: Security research with CodeQL appeared first on The GitHub Blog.


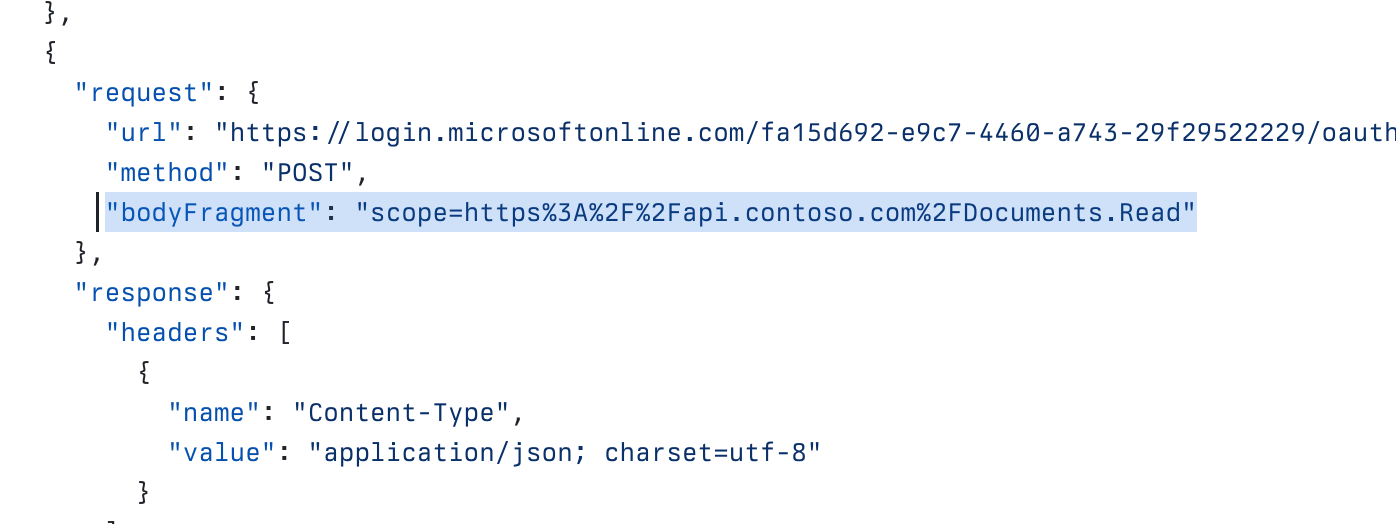 The new bodyFragment property that allows you to match mock responses based on request body.